Symmetrical Triangle Correction – Elliott Wave Perspective
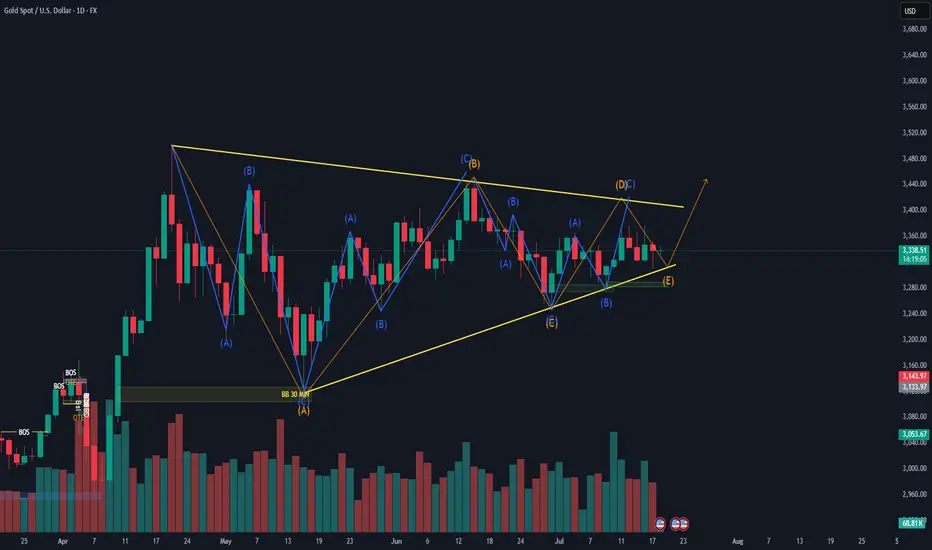
The image depicts a Symmetrical Triangle Correction, a common corrective pattern in Elliott Wave Theory. This formation is typically observed during wave 4 or within a complex correction, and it signals consolidation before the next impulsive move.
Structure:
A symmetrical triangle is composed of five corrective waves, labeled A-B-C-D-E.
Each wave itself is subdivided into a-b-c zigzag patterns, indicating a 3-3-3-3-3 structure.
The triangle is bounded by two converging trendlines—one sloping downwards and the other upwards—forming a symmetrical shape.
Key Characteristics:
Occurs after a strong impulse, representing a period of indecision or balance between bulls and bears.
Volume typically contracts during the triangle formation.
The triangle resolves in the direction of the prior trend, meaning this is usually a continuation pattern.
Each leg (A to E) gets progressively smaller, reflecting decreasing volatility.
Market Psychology:
Wave A: Initial reaction to overextension in the previous move.
Wave B: Market attempts to resume the trend but fails.
Wave C: Bears regain strength but with less momentum.
Wave D: Bulls push again, but still no breakout.
Wave E: Final shakeout before breakout.
Trading Implication:
A breakout often occurs after wave E, confirming the end of the correction.
Traders may enter positions in the direction of the prior trend with a stop below/above wave E, targeting a move equal to the widest part of the triangle.
Feragatname
Bilgiler ve yayınlar, TradingView tarafından sağlanan veya onaylanan finansal, yatırım, işlem veya diğer türden tavsiye veya tavsiyeler anlamına gelmez ve teşkil etmez. Kullanım Şartları'nda daha fazlasını okuyun.
Feragatname
Bilgiler ve yayınlar, TradingView tarafından sağlanan veya onaylanan finansal, yatırım, işlem veya diğer türden tavsiye veya tavsiyeler anlamına gelmez ve teşkil etmez. Kullanım Şartları'nda daha fazlasını okuyun.