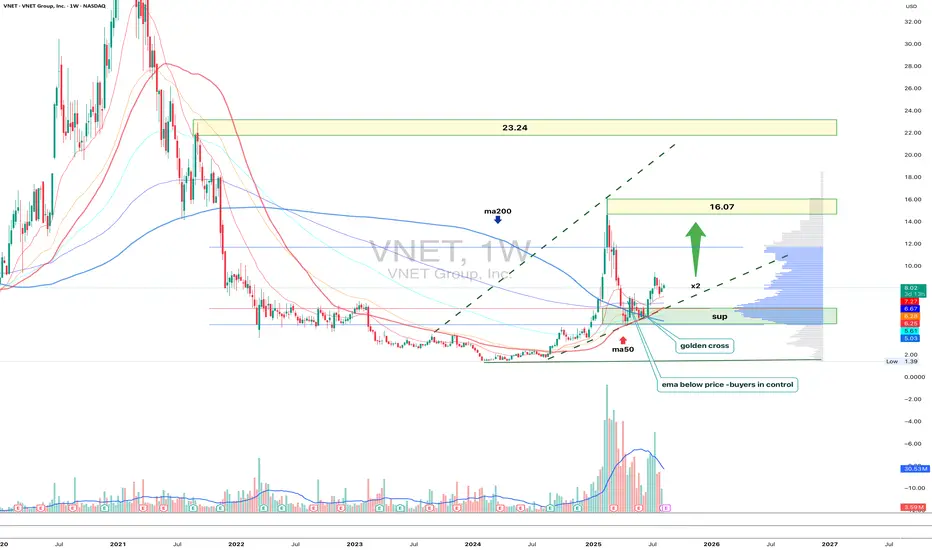
On the weekly VNET chart, the price has held above the 6.25–6.05 support zone, which previously triggered an impulsive rally. The current structure remains bullish: the MA50 is positioned above the MA200(golden cross) and ema below price(buyers control situation), and recent volume spikes indicate active buying interest. The next major resistance lies at 16.07 - where a key supply zone aligns with the previous local top. A breakout and consolidation above it would open the path toward the strategic target at 23.24, matching a Fibo extension and a historical distribution zone.
Fundamentally, VNET benefits from renewed investor interest in the Chinese tech sector and improved corporate earnings. Tactical plan: as long as 6.25–6.05 holds, long positions could target 16.07 first, with potential continuation toward 23.24.
A break below support cancels the bullish scenario. Sometimes the market offers a second chance and VNET may be one of those moments worth catching.
İşlem aktif
#VNET +50% targets at 16.07 and 23.24 respectively — if desired, you can lock in part of your position ✔️👨🎓 Наш телеграм t.me/totoshkatrading
🉐 Торгуем тут linktr.ee/totoshka55
💬 Наши контакты @Totoshkatips
🔗 Сайт totoshkatrades.com
🉐 Торгуем тут linktr.ee/totoshka55
💬 Наши контакты @Totoshkatips
🔗 Сайт totoshkatrades.com
Feragatname
Bilgiler ve yayınlar, TradingView tarafından sağlanan veya onaylanan finansal, yatırım, alım satım veya diğer türden tavsiye veya öneriler anlamına gelmez ve teşkil etmez. Kullanım Koşulları bölümünde daha fazlasını okuyun.
👨🎓 Наш телеграм t.me/totoshkatrading
🉐 Торгуем тут linktr.ee/totoshka55
💬 Наши контакты @Totoshkatips
🔗 Сайт totoshkatrades.com
🉐 Торгуем тут linktr.ee/totoshka55
💬 Наши контакты @Totoshkatips
🔗 Сайт totoshkatrades.com
Feragatname
Bilgiler ve yayınlar, TradingView tarafından sağlanan veya onaylanan finansal, yatırım, alım satım veya diğer türden tavsiye veya öneriler anlamına gelmez ve teşkil etmez. Kullanım Koşulları bölümünde daha fazlasını okuyun.