Alış
Double Bottom Chart Pattern
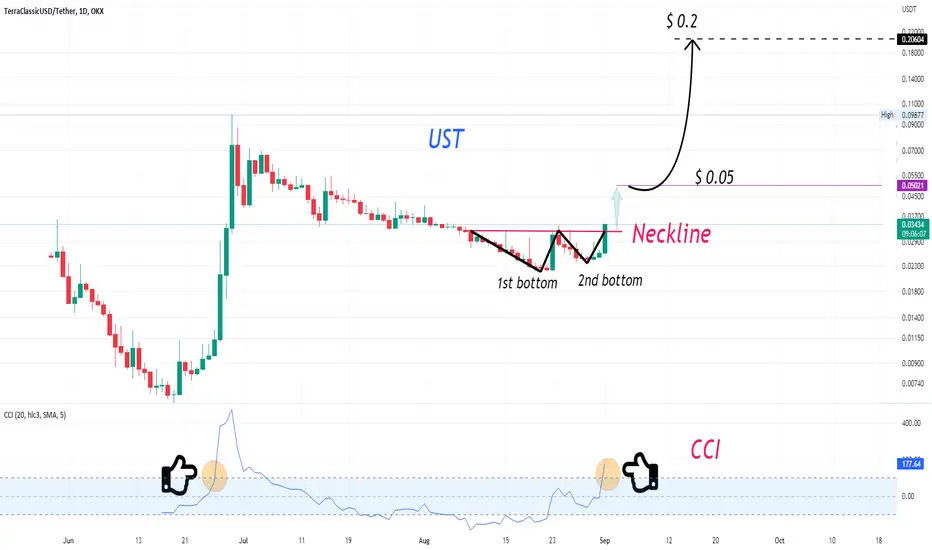
The chart above displays a double bottom pattern after a strong downtrend.
This means that there is a wide window of opportunity
Target- 1 = $ 0.05
Target -2 = $ 0.2
Target- 3= $ 0.282 (+850%)
Not
Not
Not
Not
UST +51%Not
(Yesterday), people thought I was wrong :)Not
Not
Not
Not
Not
Elliott Wave(s)Not
Not
Not
Not
Not
Not
Not
Not
İlgili yayınlar
Feragatname
Bilgiler ve yayınlar, TradingView tarafından sağlanan veya onaylanan finansal, yatırım, işlem veya diğer türden tavsiye veya tavsiyeler anlamına gelmez ve teşkil etmez. Kullanım Şartları'nda daha fazlasını okuyun.
İlgili yayınlar
Feragatname
Bilgiler ve yayınlar, TradingView tarafından sağlanan veya onaylanan finansal, yatırım, işlem veya diğer türden tavsiye veya tavsiyeler anlamına gelmez ve teşkil etmez. Kullanım Şartları'nda daha fazlasını okuyun.