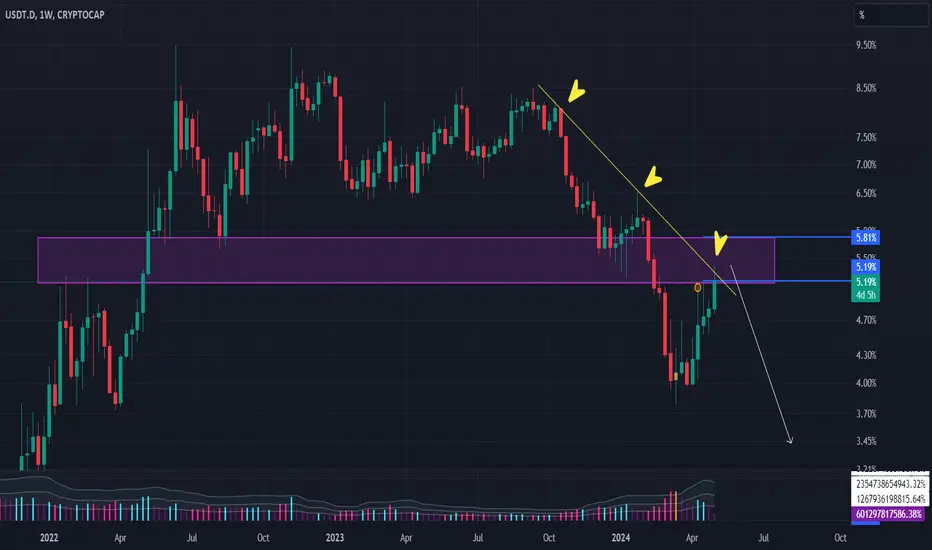
Looking at USDT Dominance chart shows that a weekly retest of 5.0% area is almost done so the whole dump in crypto over the past few weeks hasn't been something irrational !!
As you can see the 5.0% zone is a very strong resistance area meaning that USDT.D can form a top here and start the drop again which will cause the market to pump.
As you can see the 5.0% zone is a very strong resistance area meaning that USDT.D can form a top here and start the drop again which will cause the market to pump.
Feragatname
Bilgiler ve yayınlar, TradingView tarafından sağlanan veya onaylanan finansal, yatırım, işlem veya diğer türden tavsiye veya tavsiyeler anlamına gelmez ve teşkil etmez. Kullanım Şartları'nda daha fazlasını okuyun.
Feragatname
Bilgiler ve yayınlar, TradingView tarafından sağlanan veya onaylanan finansal, yatırım, işlem veya diğer türden tavsiye veya tavsiyeler anlamına gelmez ve teşkil etmez. Kullanım Şartları'nda daha fazlasını okuyun.
