USDT Dominance Weekly Chart Analysis
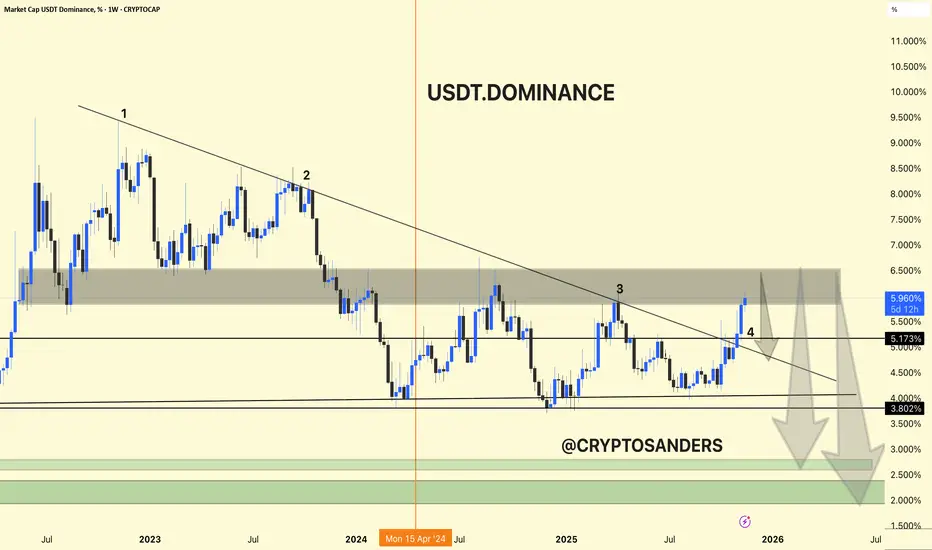
USDT dominance has been in a wide downtrend since mid-2022, repeatedly making lower highs along a major descending trendline.
Resistance Test: The dominance index is currently retesting the upper boundary of a key supply zone (5.5–6.2%), where it has previously faced sharp rejections (marked 1, 2, 3, 4).
Breakout Risk: Despite the latest rally, the price shows potential for another rejection at this supply zone, with the trendline acting as resistance.
Downside Projections: If rejected, USDT dominance may head for significant support near 4.0% and then 3.8%, with further targets at the green accumulation zone around 2.5–3.0%. This would suggest capital rotation out of stablecoins and back into crypto assets.
USDT dominance is at a major resistance, historically rejecting this trendline and zone. Another rejection here could mean reduced market fear and capital flowing back into riskier crypto assets. A sustained breakout above 6.2% would signal increased stablecoin preference and ongoing risk aversion.
DYOR | NFA
İlgili yayınlar
Feragatname
Bilgiler ve yayınlar, TradingView tarafından sağlanan veya onaylanan finansal, yatırım, alım satım veya diğer türden tavsiye veya öneriler anlamına gelmez ve teşkil etmez. Kullanım Koşulları bölümünde daha fazlasını okuyun.
İlgili yayınlar
Feragatname
Bilgiler ve yayınlar, TradingView tarafından sağlanan veya onaylanan finansal, yatırım, alım satım veya diğer türden tavsiye veya öneriler anlamına gelmez ve teşkil etmez. Kullanım Koşulları bölümünde daha fazlasını okuyun.