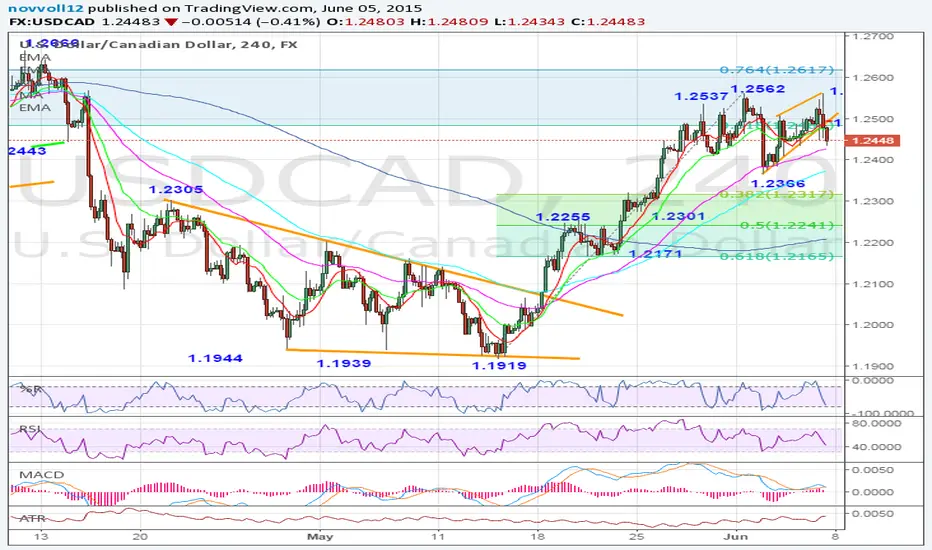
USDCAD broke down below a 4-day rising wedge (as shown on the 240 minute chart), under the 1.2562 highs (June 1/5, 2015), to expose the 1.2366 range low (June 2, 2015). A breakdown there would complete a double top at 1.2562 and weaken further towards 1.2317 (38.2% of the 1.1919/1.2562 rise). Below lies the 1.2255 support near 50% of the 1.1919/1.2562 rise and then 1.2171 near 61.8% of the 1.1919/1.2562 rise. However, back above the immediate resistance at 1.2497 then 1.2562 would defer the downside and resume the 4-week upleg from 1.1919 (May 14, 2015 low) higher.
Outlook:
Short term: bearish
Long term: bullish
Outlook:
Short term: bearish
Long term: bullish
Feragatname
Bilgiler ve yayınlar, TradingView tarafından sağlanan veya onaylanan finansal, yatırım, işlem veya diğer türden tavsiye veya tavsiyeler anlamına gelmez ve teşkil etmez. Kullanım Şartları'nda daha fazlasını okuyun.
Feragatname
Bilgiler ve yayınlar, TradingView tarafından sağlanan veya onaylanan finansal, yatırım, işlem veya diğer türden tavsiye veya tavsiyeler anlamına gelmez ve teşkil etmez. Kullanım Şartları'nda daha fazlasını okuyun.