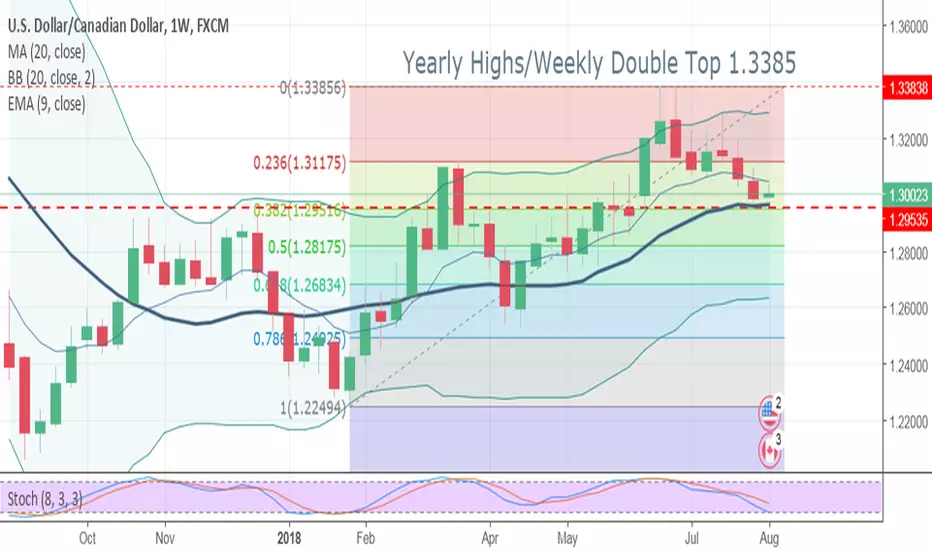
Since the rally of late-June, the USD/CAD has been consistently falling. BoC tightening and WTI crude values have been primary reasons behind the move. As a result, several key technical support levels are coming into view.
The 38% Fibonacci retracement of the yearly range (1.2950) is a fantastic place to go long in the USD/CAD. This will be a make-or-break area for this market. If it holds, a return to yearly highs are likely in the cards for the fall season.
Here is the trade:
1)Entry: Buy 1.2960
2)Stop Loss: 1.2894
3)Profit Target: 1.3092
4)Risk vs Reward: 1/2
Feragatname
Bilgiler ve yayınlar, TradingView tarafından sağlanan veya onaylanan finansal, yatırım, alım satım veya diğer türden tavsiye veya öneriler anlamına gelmez ve teşkil etmez. Kullanım Koşulları bölümünde daha fazlasını okuyun.
Feragatname
Bilgiler ve yayınlar, TradingView tarafından sağlanan veya onaylanan finansal, yatırım, alım satım veya diğer türden tavsiye veya öneriler anlamına gelmez ve teşkil etmez. Kullanım Koşulları bölümünde daha fazlasını okuyun.