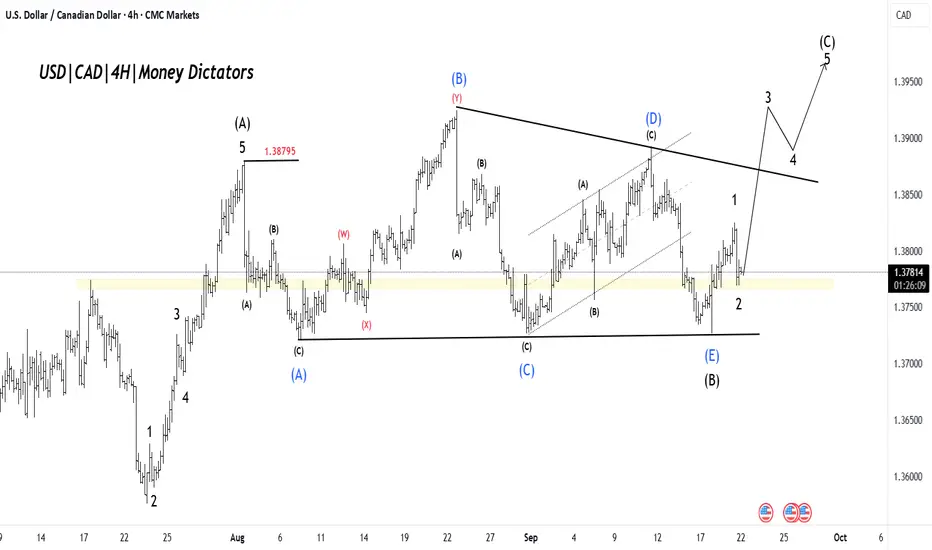
USD/CAD Price is showing the early stages of a bullish (C) leg after a large corrective sequence. The chart labels show a completed corrective (B) low at the horizontal support and an impulsive 1–2 sequence unfolding for the new upward leg. Bias: bullish while price holds above the demand zone/wave-2 low.
The market completed an ABC correction that found support on the horizontal lower boundary. That corrective phase looks finished; we should now be in wave (C) up, the final leg of the correction.
Short-term momentum has flipped, with buyers stepping in at support. This favors trend-following longs into the extension leg (wave 3 → 5)
Target 1 (T1): 1.38408
Target 2 (T2): 1.38810
Stop-Loss (SL): 1.37195
İşlem kapandı: hedefe ulaştı
Enjoy the profit!Life-time free telegram channel - t.me/moneydictators
İlgili yayınlar
Feragatname
Bilgiler ve yayınlar, TradingView tarafından sağlanan veya onaylanan finansal, yatırım, işlem veya diğer türden tavsiye veya tavsiyeler anlamına gelmez ve teşkil etmez. Kullanım Şartları'nda daha fazlasını okuyun.
Life-time free telegram channel - t.me/moneydictators
İlgili yayınlar
Feragatname
Bilgiler ve yayınlar, TradingView tarafından sağlanan veya onaylanan finansal, yatırım, işlem veya diğer türden tavsiye veya tavsiyeler anlamına gelmez ve teşkil etmez. Kullanım Şartları'nda daha fazlasını okuyun.