Buongiorno,
Il grande Jesse Livermore disse: TRADA QUELLO CHE VEDI E NON QUELLO CHE PENSI.
Se vi piace il mio metodo, lasciate un like e seguite il profilo, è molto importante per me, grazie!
SP500
TF settimanale.
Possiamo notare il prezzo che si muove all'interno di un canale ben definito e che si mantiene stabilmente sopra la EMA 21.
Si può vedere che lo stesso sta accumulando a ridosso della TL superiore da circa 5 mesi.

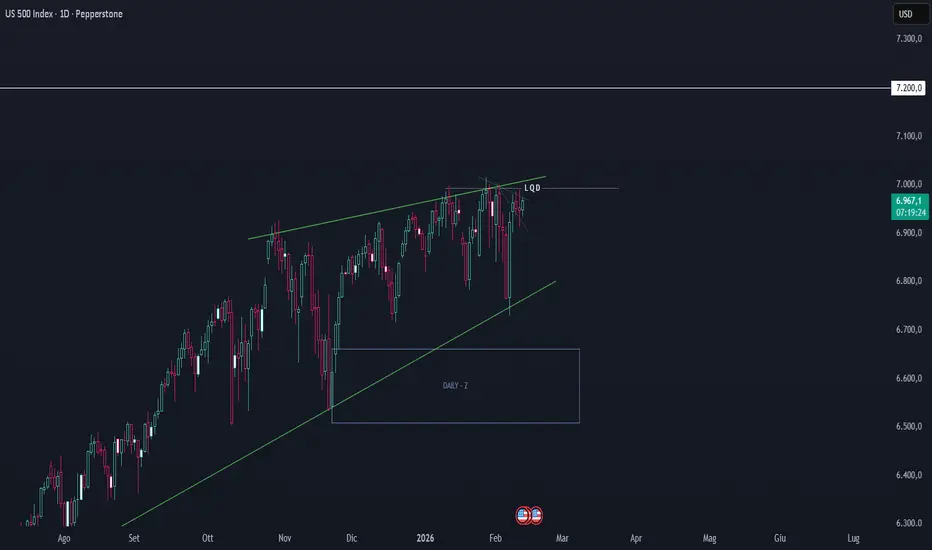
TF giornaliero.
Il prezzo ha disegnato un bel cuneo ed in questo momento ci avviamo nella sua fase di restringimento.
Da notare che ogni accenno di discesa è stato prontamente rimangiato da grandi candele rialziste.
Il trend appare stabilmente rialzista.
Interessante la zona di domanda giornaliera sotto molto importante e da valutare in caso di ritracciamento profondo.
Resistenza importante a ridosso dei 7.000 punti.

Operatività.
Come al solito seguo sempre e solo il trend principale che è quello rialzista.
In caso di rottura della TL superiore e della resistenza a 7.000 mi aspetto un allungo verso i 7.200.

Scenari ribassisti sotto i 6.500 punti.
Restate sintonizzati, seguiranno aggiornamenti!
A presto
Mind Primacy
Disclaimer: tutte le analisi esposte attraverso questo profilo non rappresentano consigli finanziari, ma la mia personale visione basata sulle strategie operative di trading che utilizzo.
_____________________________________________________________________________
English
Hello everyone,
The great Jesse Livermore once said: TRADE WHAT YOU SEE, NOT WHAT YOU THINK.
If you appreciate my analysis method, please drop a like and follow my profile—it means a lot to me. Thank you!
SP500
Weekly TF.
The price is moving within a well-defined channel, consistently holding above the 21 EMA. We can observe an accumulation phase near the upper trendline (TL) that has been ongoing for about 5 months.
Daily TF.
Price action has formed a clean wedge pattern, currently entering its narrowing phase (apex). It’s worth noting that every attempted dip has been quickly absorbed by strong bullish candles. The trend remains firmly bullish. A key daily demand zone sits below; this area is crucial to monitor in the event of a deep retracement. Significant resistance is seen around the 7,000 level.
Trading Idea.
As always, I am sticking with the primary trend, which is bullish. In the event of a breakout above the upper TL and the 7,000 resistance, I expect a move toward the 7,200 target.
Bearish Scenario.
The bullish bias is invalidated with a sustained close below 6,500.
Stay tuned for further updates!
Il grande Jesse Livermore disse: TRADA QUELLO CHE VEDI E NON QUELLO CHE PENSI.
Se vi piace il mio metodo, lasciate un like e seguite il profilo, è molto importante per me, grazie!
SP500
TF settimanale.
Possiamo notare il prezzo che si muove all'interno di un canale ben definito e che si mantiene stabilmente sopra la EMA 21.
Si può vedere che lo stesso sta accumulando a ridosso della TL superiore da circa 5 mesi.
TF giornaliero.
Il prezzo ha disegnato un bel cuneo ed in questo momento ci avviamo nella sua fase di restringimento.
Da notare che ogni accenno di discesa è stato prontamente rimangiato da grandi candele rialziste.
Il trend appare stabilmente rialzista.
Interessante la zona di domanda giornaliera sotto molto importante e da valutare in caso di ritracciamento profondo.
Resistenza importante a ridosso dei 7.000 punti.
Operatività.
Come al solito seguo sempre e solo il trend principale che è quello rialzista.
In caso di rottura della TL superiore e della resistenza a 7.000 mi aspetto un allungo verso i 7.200.
Scenari ribassisti sotto i 6.500 punti.
Restate sintonizzati, seguiranno aggiornamenti!
A presto
Mind Primacy
Disclaimer: tutte le analisi esposte attraverso questo profilo non rappresentano consigli finanziari, ma la mia personale visione basata sulle strategie operative di trading che utilizzo.
_____________________________________________________________________________
English
Hello everyone,
The great Jesse Livermore once said: TRADE WHAT YOU SEE, NOT WHAT YOU THINK.
If you appreciate my analysis method, please drop a like and follow my profile—it means a lot to me. Thank you!
SP500
Weekly TF.
The price is moving within a well-defined channel, consistently holding above the 21 EMA. We can observe an accumulation phase near the upper trendline (TL) that has been ongoing for about 5 months.
Daily TF.
Price action has formed a clean wedge pattern, currently entering its narrowing phase (apex). It’s worth noting that every attempted dip has been quickly absorbed by strong bullish candles. The trend remains firmly bullish. A key daily demand zone sits below; this area is crucial to monitor in the event of a deep retracement. Significant resistance is seen around the 7,000 level.
Trading Idea.
As always, I am sticking with the primary trend, which is bullish. In the event of a breakout above the upper TL and the 7,000 resistance, I expect a move toward the 7,200 target.
Bearish Scenario.
The bullish bias is invalidated with a sustained close below 6,500.
Stay tuned for further updates!
La consapevolezza sui mercati.
genisysfx.com/
genisysfx.com/
Feragatname
Bilgiler ve yayınlar, TradingView tarafından sağlanan veya onaylanan finansal, yatırım, alım satım veya diğer türden tavsiye veya öneriler anlamına gelmez ve teşkil etmez. Kullanım Koşulları bölümünde daha fazlasını okuyun.
La consapevolezza sui mercati.
genisysfx.com/
genisysfx.com/
Feragatname
Bilgiler ve yayınlar, TradingView tarafından sağlanan veya onaylanan finansal, yatırım, alım satım veya diğer türden tavsiye veya öneriler anlamına gelmez ve teşkil etmez. Kullanım Koşulları bölümünde daha fazlasını okuyun.