US Treasury 10Y Technical Outlook for the week July 7-July 11 (updated daily)
Overnight
The US 10-year Treasury yield increased by 6 basis points to 4.34%. A stronger-than-expected jobs report triggered the rise. Nonfarm payrolls reached 147,000 in June. April and May payroll figures were revised higher. The unemployment rate dropped to 4.1%. Wage growth slowed to 0.2%. Investors eliminated expectations for a July Federal Reserve rate cut. The probability of a September rate cut fell to approximately 80%. Fed Chair Powell advocated a cautious approach. A significant bill advanced through Congress.
Source: TradingView News (Trading Economics)
Economic Release week July 7-11 myfxbook.com/forex-economic-calendar
Technical Outlook
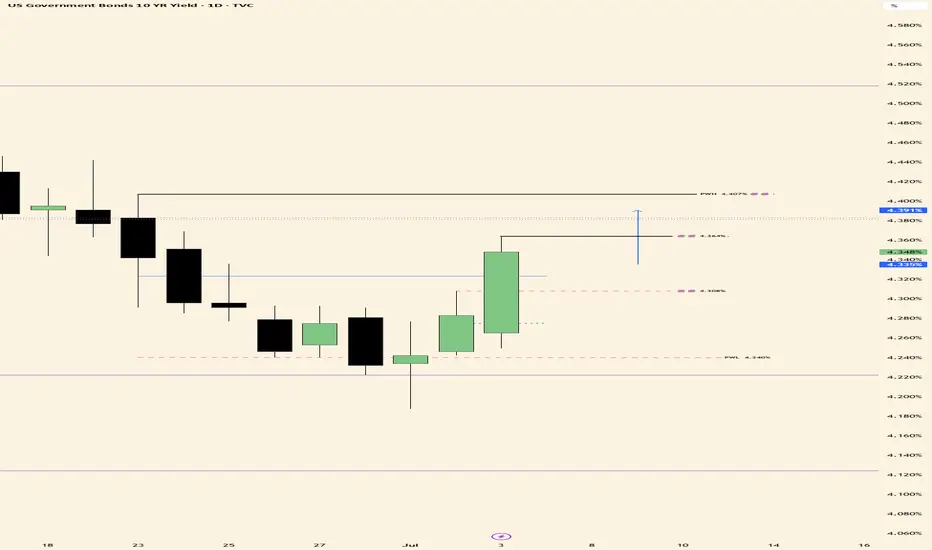
Monthly Chart, tradingview.com/x/9hQBWn6d/, I am expecting a support (in px) at 4.37%, the 50% fib level of previous month. If it continuous to punch through then I would expect a target of previous month high of 4.518% is in play. Weekly Chart, tradingview.com/x/io1s8UxF/, following a sweep of previous week low with strong rejection, I am expecting market to target previous week high (PWH) of 4.407%. It is also worth to note that the week is closing above 50% range of last week with no signs of rejection. Daily chart, , yesterday I mentioned “ wich leads me to expect a continuation to target yesterday’s high of 4.308%” the lvl was reached and market closed through the previous day’s high which leads me to expect the next daily target will be
**Disclaimer:**
The technical analyses provided herein are based solely on my personal analysis and are intended for my own study and reference. They do not constitute a recommendation or solicitation to buy or sell any financial instruments. Any decision made by individuals based on this analysis is their own responsibility, and I assume no liability for any losses or damages incurred as a result of using this information. It is advisable to conduct thorough research and consult with a qualified financial advisor before making any investment decisions.
Overnight
The US 10-year Treasury yield increased by 6 basis points to 4.34%. A stronger-than-expected jobs report triggered the rise. Nonfarm payrolls reached 147,000 in June. April and May payroll figures were revised higher. The unemployment rate dropped to 4.1%. Wage growth slowed to 0.2%. Investors eliminated expectations for a July Federal Reserve rate cut. The probability of a September rate cut fell to approximately 80%. Fed Chair Powell advocated a cautious approach. A significant bill advanced through Congress.
Source: TradingView News (Trading Economics)
Economic Release week July 7-11 myfxbook.com/forex-economic-calendar
Technical Outlook
Monthly Chart, tradingview.com/x/9hQBWn6d/, I am expecting a support (in px) at 4.37%, the 50% fib level of previous month. If it continuous to punch through then I would expect a target of previous month high of 4.518% is in play. Weekly Chart, tradingview.com/x/io1s8UxF/, following a sweep of previous week low with strong rejection, I am expecting market to target previous week high (PWH) of 4.407%. It is also worth to note that the week is closing above 50% range of last week with no signs of rejection. Daily chart,
**Disclaimer:**
The technical analyses provided herein are based solely on my personal analysis and are intended for my own study and reference. They do not constitute a recommendation or solicitation to buy or sell any financial instruments. Any decision made by individuals based on this analysis is their own responsibility, and I assume no liability for any losses or damages incurred as a result of using this information. It is advisable to conduct thorough research and consult with a qualified financial advisor before making any investment decisions.
Not
friday was US holiday so above serves as weekly / monday uodateNot
US Treasury 10Y Daily TechnicalOvernight
The yield on the U.S. 10-year Treasury note remained stable at approximately 4.36% on Monday, close to a two-week high, as investors assessed recent trade developments following a long weekend. President Trump announced new trade deals and formal notifications to countries without agreements, specifying new tariff levels. Reciprocal tariffs are set to take effect on August 1, allowing a three-week period for negotiations before the current 90-day truce expires on July 9. Additionally, Trump stated that countries aligning with the BRICS bloc’s “anti-American policies” will face an extra 10% tariff on exports to the U.S. On July 4, President Trump signed a bill into law, projected to increase federal deficits by over $3 trillion over the next decade.
Economic Release today July 8 myfxbook.com/forex-economic-calendar
Daily Technical Bias
Monday’s rates moved higher and closed through Thursday’s high which leads me to believe today it will target Monday’s high of 4.399% and also watching weekly bias target of 4.407%. A strong close through above this level will be looking at 4.462%. If yield just wicks and close below 4.399% will tell me a possible consolidation and/or reversal is coming.
Continue to monitor the fundamental news event specially tariff as this will extremely affect the market.
**Disclaimer:**
The technical analyses provided herein are based solely on my personal analysis and are intended for my own study and reference. They do not constitute a recommendation or solicitation to buy or sell any financial instruments. Any decision made by individuals based on this analysis is their own responsibility, and I assume no liability for any losses or damages incurred as a result of using this information. It is advisable to conduct thorough research and consult with a qualified financial advisor before making any investment decisions.
Not
US Treasury 10Y Daily Technical July 9Overnight
On Tuesday, the US 10-year Treasury note yield climbed nearly 5 basis points to 4.43%, the highest since mid-June, driven by trade developments and an extended August 1st deadline for reciprocal tariffs, allowing more time for negotiations. President Trump announced revised tariffs, including a 25% levy on Japanese imports, for 14 nations without finalized US trade deals. The US also proposed a 10% baseline tariff on EU goods. Speculation of additional fiscal stimulus in Japan ahead of its July 20 upper house elections pressured global bond markets, particularly longer-maturity bonds. The US 30-year Treasury yield approached 5%.
Source: Tradingview News
Economic Release July 9 myfxbook.com/forex-economic-calendar
Daily Bias
As expected all levels we expected yesterday were reached. Tuesday closed above Monday’s high which makes my bias today at yesterday’s high of 4.335%. There might also be chance that market could consolidate given that yield has been moving higher for 5 consecutive days just something to note and consider. Yield also has not closed above our weekly bias of 4.407%.
So to sum up daily bias 4.435% with a chance of a consolidation. Also note a possible resistance zone in price at 4.364%-4.379%
**Disclaimer:**
The technical analyses provided herein are based solely on my personal analysis and are intended for my own study and reference. They do not constitute a recommendation or solicitation to buy or sell any financial instruments. Any decision made by individuals based on this analysis is their own responsibility, and I assume no liability for any losses or damages incurred as a result of using this information. It is advisable to conduct thorough research and consult with a qualified financial advisor before making any investment decisions.
Not
US Treasury 10Y Daily Technical July 10Overnight
The yield on the 10-year US Treasury note declined to 4.35% as markets evaluated new trade policy developments and their potential effects on future interest rates and risk premia, according to Trading Economics. The latest FOMC meeting minutes revealed that most policymakers anticipate multiple rate cuts in 2025, though some members view tariffs as inflationary, leading to projections of no cuts this year. Rate futures indicate expectations for cuts in September and December. Strong demand at the recent 10-year note auction provided additional support. Meanwhile, President Trump’s expanded tariff proposals on various countries and sectors, alongside signals of a significantly lower Funds rate, have heightened inflation expectations and speculation of a dovish Federal Reserve nominee for the coming year.
Economic Release July 10 myfxbook.com/forex-economic-calendar
Daily Bias
The FOMC minutes completely changed the outlook on chart. On the weekly, we see a big wick rejection from old weekly high and now rates trading below previous week high showing a possible reversal for next coming week (
**Disclaimer:**
The technical analyses provided herein are based solely on my personal analysis and are intended for my own study and reference. They do not constitute a recommendation or solicitation to buy or sell any financial instruments. Any decision made by individuals based on this analysis is their own responsibility, and I assume no liability for any losses or damages incurred as a result of using this information. It is advisable to conduct thorough research and consult with a qualified financial advisor before making any investment decisions.
Not
US Treasury 10Y Daily Technical July 11Overnight
The 10-year US Treasury note yield stabilized at 4.33% after a sharp decline, driven by strong demand in a recent bond auction. Federal Reserve minutes indicate openness to 2025 rate cuts, while President Trump’s call for a 300-basis-point Fed funds rate reduction has raised inflation expectations. Trump also imposed a 50% tariff on Brazilian imports and 25-30% tariffs on imports from the Philippines, Brunei, Moldova, Algeria, Iraq, Libya, and Sri Lanka, effective August 1, citing unfair trade practices. Markets await potential trade agreements with India and the EU.
Economic Releases July 11 myfxbook.com/forex-economic-calendar
Very light on the economic releases today but next week we will be expecting CPI and Inflation numbers on Tuesday and PPI on Wednesday so these are the days to watch out for in terms of volatility.
Daily Technical
As anticipated, the identified support zone was tested and rejected. The Wednesday low of 4.332% was breached but did not close below this level, instead closing above it. This suggests potential strength in the price action, indicating a possible retest of Thursday’s high at 4.375%.
On the weekly timeframe, the price action appears to have turned bullish in price after sweeping the previous week's high and a prior weekly high. The closure of the current weekly candle will be critical in confirming this bullish momentum.
**Disclaimer:**
The technical analyses provided herein are based solely on my personal analysis and are intended for my own study and reference. They do not constitute a recommendation or solicitation to buy or sell any financial instruments. Any decision made by individuals based on this analysis is their own responsibility, and I assume no liability for any losses or damages incurred as a result of using this information. It is advisable to conduct thorough research and consult with a qualified financial advisor before making any investment decisions.
Feragatname
Bilgiler ve yayınlar, TradingView tarafından sağlanan veya onaylanan finansal, yatırım, işlem veya diğer türden tavsiye veya tavsiyeler anlamına gelmez ve teşkil etmez. Kullanım Şartları'nda daha fazlasını okuyun.
Feragatname
Bilgiler ve yayınlar, TradingView tarafından sağlanan veya onaylanan finansal, yatırım, işlem veya diğer türden tavsiye veya tavsiyeler anlamına gelmez ve teşkil etmez. Kullanım Şartları'nda daha fazlasını okuyun.