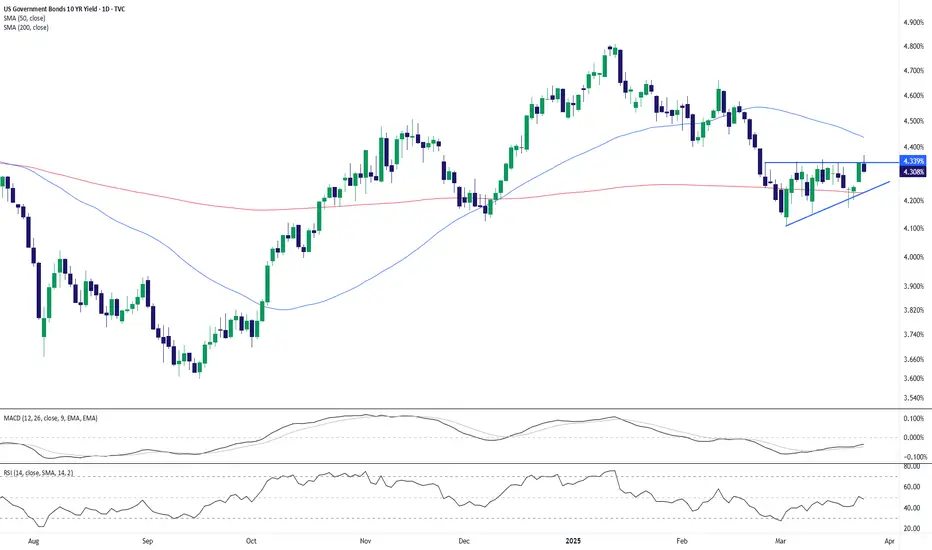
The U.S. 10-year Treasury yield is hovering just beneath the 4.34% resistance level, with price forming a tight ascending triangle just under this key level. Today’s pullback to 4.31% (-0.74%) suggests hesitation from bulls as momentum indicators turn mixed.
🔹 MACD is flat, showing a lack of directional conviction.
🔹 RSI sits at 47.94, neutral and non-committal.
🔹 Price remains sandwiched between the 50-day SMA (4.43%) and the 200-day SMA (4.22%).
A confirmed breakout above 4.34% could open the door for a run toward 4.50% or even 4.80%. Conversely, a drop below the rising trendline (~4.24%) would expose downside risk toward the 200-day SMA.
Watch for a catalyst (Fed commentary or inflation data) to break the deadlock.
-MW
Feragatname
Bilgiler ve yayınlar, TradingView tarafından sağlanan veya onaylanan finansal, yatırım, işlem veya diğer türden tavsiye veya tavsiyeler anlamına gelmez ve teşkil etmez. Kullanım Şartları'nda daha fazlasını okuyun.
Feragatname
Bilgiler ve yayınlar, TradingView tarafından sağlanan veya onaylanan finansal, yatırım, işlem veya diğer türden tavsiye veya tavsiyeler anlamına gelmez ve teşkil etmez. Kullanım Şartları'nda daha fazlasını okuyun.