While the long-term trend remains bullish, several short-term factors suggest the index is poised for a significant pullback.
Why the US100 Could Be Bearish
Several key factors point to a potential downturn for the US100 in the coming days:
Key Technical Levels to Watch
A breakdown of key support and resistance levels can help define the potential bearish path.
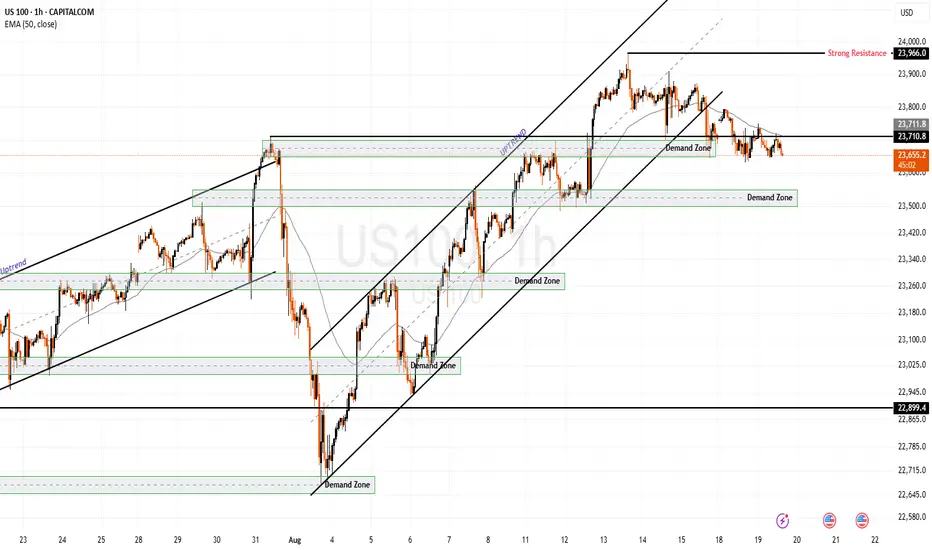
Primary Resistance Zone: The immediate overhead resistance is the all-time high zone, which sits between 23,875 and 24,000. A failure to break above this area would confirm a bearish bias.
Immediate Support: The first critical support level is around 23,690. A sustained break below this would likely trigger further selling.
Correction Targets: A deeper correction could see the index fall toward the 23,500 zone, which represents a key technical support level. If that level breaks, the next target for bears would be the 22,800 mark.
In summary, while the long-term trend remains positive, the confluence of high valuations, potential hawkish Fed commentary, and a weakening economic outlook creates a significant risk for a bearish correction in the US100 over the next two weeks.
Why the US100 Could Be Bearish
Several key factors point to a potential downturn for the US100 in the coming days:
- Elevated Valuations and Overbought Conditions: The US100 has experienced a rapid and significant rally in recent months, fueled largely by the enthusiasm for AI and the "Magnificent 7" tech stocks. This has pushed the index to all-time highs, but it has also led to stretched valuations. Many technical indicators, such as the Relative Strength Index (RSI), show that the index is overbought, indicating that momentum may be running out and a correction is due. 📉
- Doubt on a Fed Rate Cut: While recent inflation data showed a slight cooling, some analysts are pushing back against the idea of a certain September rate cut. The core inflation number remains above the Fed's 2% target, and some Fed officials may express a more cautious or "hawkish" stance at this week's Jackson Hole Symposium. A hawkish surprise from the Fed would likely lead to a sharp sell-off in growth stocks, which are sensitive to interest rates.
- Geopolitical and Trade Uncertainty: The ongoing trade tensions, particularly with China, continue to create a cloud of uncertainty. While a temporary truce has been announced, any renewed rhetoric or action could trigger a flight to safety, with investors pulling money out of riskier assets like technology stocks.
- Slowing Economic Growth: The U.S. economy's underlying health remains a concern. GDP growth in the first half of the year was modest, and the labor market has shown signs of weakening. This economic softness, combined with the potential for tariffs to increase inflation in the second half of the year, could lead to a less optimistic outlook for corporate earnings, especially for multinational tech companies.
Key Technical Levels to Watch
A breakdown of key support and resistance levels can help define the potential bearish path.
Primary Resistance Zone: The immediate overhead resistance is the all-time high zone, which sits between 23,875 and 24,000. A failure to break above this area would confirm a bearish bias.
Immediate Support: The first critical support level is around 23,690. A sustained break below this would likely trigger further selling.
Correction Targets: A deeper correction could see the index fall toward the 23,500 zone, which represents a key technical support level. If that level breaks, the next target for bears would be the 22,800 mark.
In summary, while the long-term trend remains positive, the confluence of high valuations, potential hawkish Fed commentary, and a weakening economic outlook creates a significant risk for a bearish correction in the US100 over the next two weeks.
İşlem aktif
This trade setup is now running 300+ Points! It can only be the 15:30 NAS100 STRATEGY 📈İşlem kapandı: hedefe ulaştı
The lowest point reached was 22 963! Over +700 Points setup. Wow!! With multiple entries this was a guaranteed life changing trade idea. Thanks to the 15:30 NAS100 STRATEGY 🤑Feragatname
Bilgiler ve yayınlar, TradingView tarafından sağlanan veya onaylanan finansal, yatırım, işlem veya diğer türden tavsiye veya tavsiyeler anlamına gelmez ve teşkil etmez. Kullanım Şartları'nda daha fazlasını okuyun.
Feragatname
Bilgiler ve yayınlar, TradingView tarafından sağlanan veya onaylanan finansal, yatırım, işlem veya diğer türden tavsiye veya tavsiyeler anlamına gelmez ve teşkil etmez. Kullanım Şartları'nda daha fazlasını okuyun.