This posts presents an idea that has no precedence (that I can recall at least), so this is by definition a crazy idea BUT the chart is showing signs of extreme exhaustion and is possibly and quite frankly on the verge of a potentially destructive collapse.
If the recent severe volatility hasn't peaked your attention... this chart should.
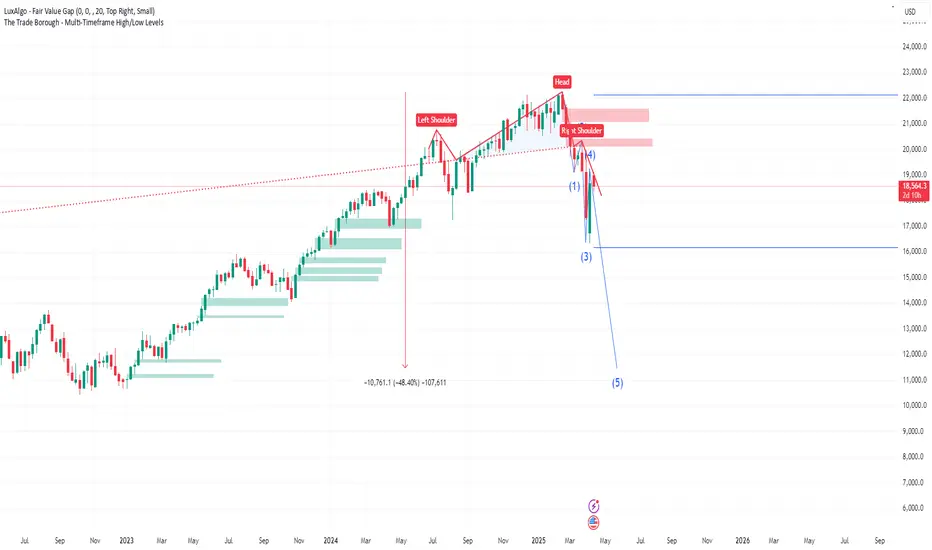
It's quite simple...we have a MONSTER Head and Shoulders pattern on the Weekly TF...and we're finishing off the Right Shoulder! From a chart pattern perspective, this is ultra-ultra bearish.
The confluence we have is the Elliot Wave showing the we could be about to enter Wave 5. Elliot Waves are of course subjective BUT in this case its syncs with the Head and Shoulders.
If this was a 15min chart, most would probably agree hands down, but this is a Weekly Chart and represents Trillions on Trillions so its hard to believe that this could even be a possibility.....but I believe it could happen!
The horizontal blue lines provide 2024's High and Low Price. For this disaster scenario to be avoided, the Bulls and anyone who cares must defend 2024's low around 16100. This must not be breached, to keep the 12M bullish structure in place.
The green shaded areas highlight all of the Buy Side fair value gaps on the WEEKLY TF going back to early January 2023!
Could the market dive for these in devastating fashion? Only time will tell.
In the interim, we should trade safe and manage risk as best as we can.
If the recent severe volatility hasn't peaked your attention... this chart should.
It's quite simple...we have a MONSTER Head and Shoulders pattern on the Weekly TF...and we're finishing off the Right Shoulder! From a chart pattern perspective, this is ultra-ultra bearish.
The confluence we have is the Elliot Wave showing the we could be about to enter Wave 5. Elliot Waves are of course subjective BUT in this case its syncs with the Head and Shoulders.
If this was a 15min chart, most would probably agree hands down, but this is a Weekly Chart and represents Trillions on Trillions so its hard to believe that this could even be a possibility.....but I believe it could happen!
The horizontal blue lines provide 2024's High and Low Price. For this disaster scenario to be avoided, the Bulls and anyone who cares must defend 2024's low around 16100. This must not be breached, to keep the 12M bullish structure in place.
The green shaded areas highlight all of the Buy Side fair value gaps on the WEEKLY TF going back to early January 2023!
Could the market dive for these in devastating fashion? Only time will tell.
In the interim, we should trade safe and manage risk as best as we can.
İşlem elle kapatılmış
The beautiful thing about trading is that time always reveals new pictures. The one I think I can see now is even crazier than this....so I will close this idea now and create another one to explainİlgili yayınlar
Feragatname
Bilgiler ve yayınlar, TradingView tarafından sağlanan veya onaylanan finansal, yatırım, işlem veya diğer türden tavsiye veya tavsiyeler anlamına gelmez ve teşkil etmez. Kullanım Şartları'nda daha fazlasını okuyun.
İlgili yayınlar
Feragatname
Bilgiler ve yayınlar, TradingView tarafından sağlanan veya onaylanan finansal, yatırım, işlem veya diğer türden tavsiye veya tavsiyeler anlamına gelmez ve teşkil etmez. Kullanım Şartları'nda daha fazlasını okuyun.