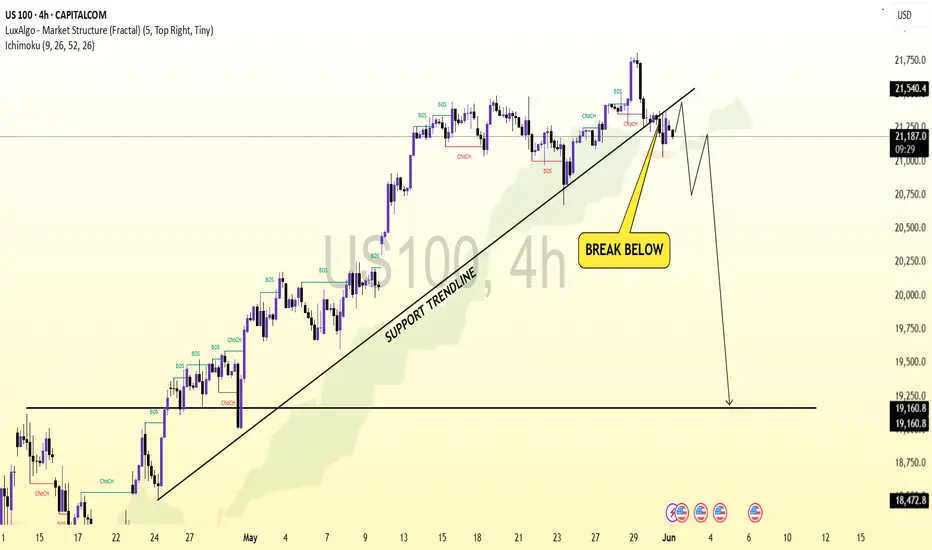
This 4-hour chart of the US100 (Nasdaq 100) shows a break below a long-standing ascending support trendline. The price has breached the trendline and is currently retesting the underside, suggesting a potential bearish reversal.
Key points:
The trendline break signals a possible end to the previous bullish momentum.
A retest of the broken support turned resistance is in progress.
If the price fails to reclaim the trendline, a deeper drop toward the 19,160 and 18,472 levels is likely.
The projected path indicates a short-term bounce followed by a significant bearish move.
Overall, the chart suggests bearish sentiment unless buyers reclaim and hold above the broken trendline.
JOIN MY TELEGRAM:
FREE SIGNALS TECHNICAL CHART AND EDUCATOIN
t.me/+j_sv6p9sL5I0MDY0
FREE SIGNALS TECHNICAL CHART AND EDUCATOIN
t.me/+j_sv6p9sL5I0MDY0
Feragatname
Bilgiler ve yayınlar, TradingView tarafından sağlanan veya onaylanan finansal, yatırım, işlem veya diğer türden tavsiye veya tavsiyeler anlamına gelmez ve teşkil etmez. Kullanım Şartları'nda daha fazlasını okuyun.