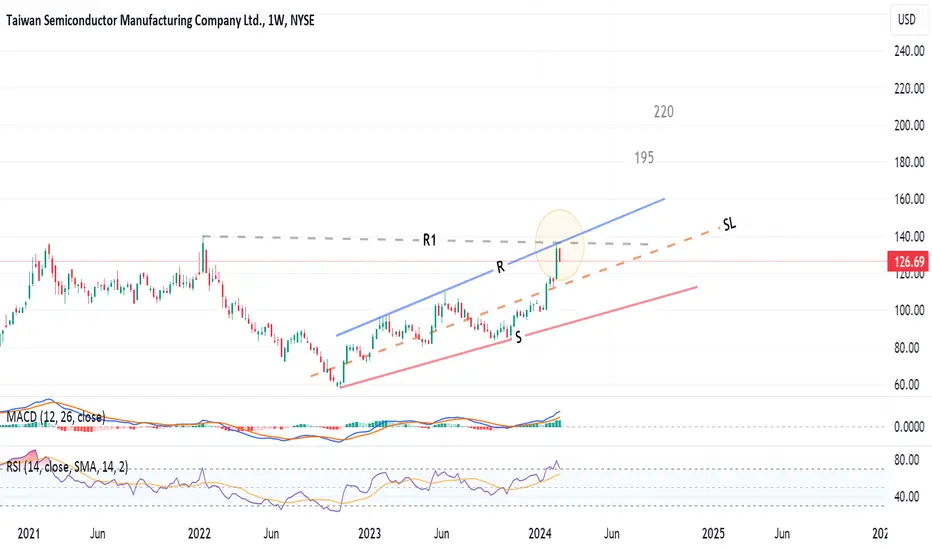
Weekly chart, the stock reached a cluster of resistances R1 and R, and could not cross.
There is a tendency to test the mid line or the support line S
Above the R line, a rising expanding wedge pattern will be completed, and the target will be 195 then 220
Stop loss below SL line
There is a tendency to test the mid line or the support line S
Above the R line, a rising expanding wedge pattern will be completed, and the target will be 195 then 220
Stop loss below SL line
Feragatname
Bilgiler ve yayınlar, TradingView tarafından sağlanan veya onaylanan finansal, yatırım, alım satım veya diğer türden tavsiye veya öneriler anlamına gelmez ve teşkil etmez. Kullanım Koşulları bölümünde daha fazlasını okuyun.
Feragatname
Bilgiler ve yayınlar, TradingView tarafından sağlanan veya onaylanan finansal, yatırım, alım satım veya diğer türden tavsiye veya öneriler anlamına gelmez ve teşkil etmez. Kullanım Koşulları bölümünde daha fazlasını okuyun.