Overview: let's review a few key points of the last update:
Update: TSLA minute structure was quite different than my expectation, in that wave I extended lower than I thought. Looking at the hourly chart, I think wave I is now complete and we are in the process of wave II.

Potential targets for wave II peak? (282.31-292)
1) Retracement of wave I: 282.31, 284.68, 286.24, and 290.41.
2) Volume profile of wave I: 284.52 and 289.07 (note that these are not exact).

3) Support and resistance levels: 287.06, 292.25, and 296.48 (note that these are not exact).

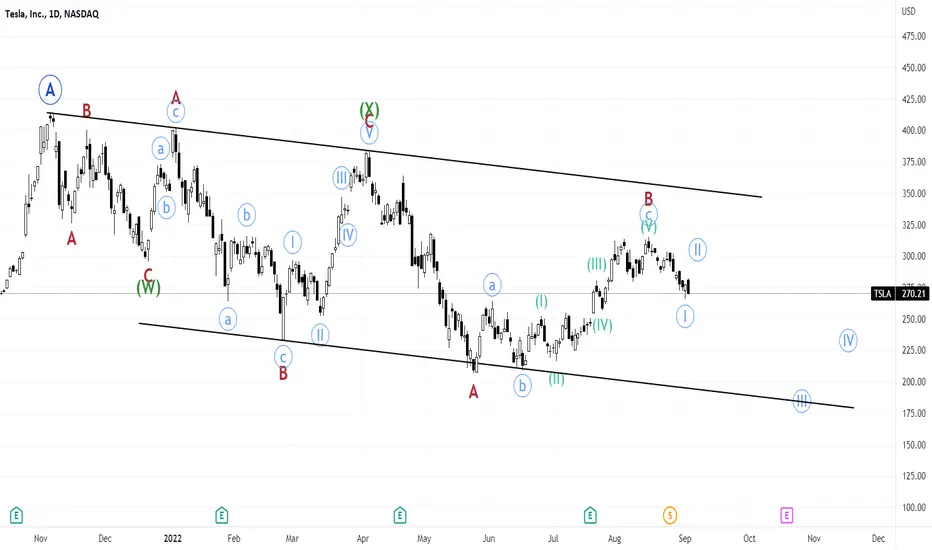
- I believe TSLA is close to the completion of wave I of C of (Y) of B.
- Based on the hourly chart, I see that wave III of (c) of I is almost complete and I expect the blue channel to hold the bottom of wave I, initiating the pullback for wave II.
Update: TSLA minute structure was quite different than my expectation, in that wave I extended lower than I thought. Looking at the hourly chart, I think wave I is now complete and we are in the process of wave II.
Potential targets for wave II peak? (282.31-292)
1) Retracement of wave I: 282.31, 284.68, 286.24, and 290.41.
2) Volume profile of wave I: 284.52 and 289.07 (note that these are not exact).
3) Support and resistance levels: 287.06, 292.25, and 296.48 (note that these are not exact).
İlgili yayınlar
Feragatname
Bilgiler ve yayınlar, TradingView tarafından sağlanan veya onaylanan finansal, yatırım, işlem veya diğer türden tavsiye veya tavsiyeler anlamına gelmez ve teşkil etmez. Kullanım Şartları'nda daha fazlasını okuyun.
İlgili yayınlar
Feragatname
Bilgiler ve yayınlar, TradingView tarafından sağlanan veya onaylanan finansal, yatırım, işlem veya diğer türden tavsiye veya tavsiyeler anlamına gelmez ve teşkil etmez. Kullanım Şartları'nda daha fazlasını okuyun.