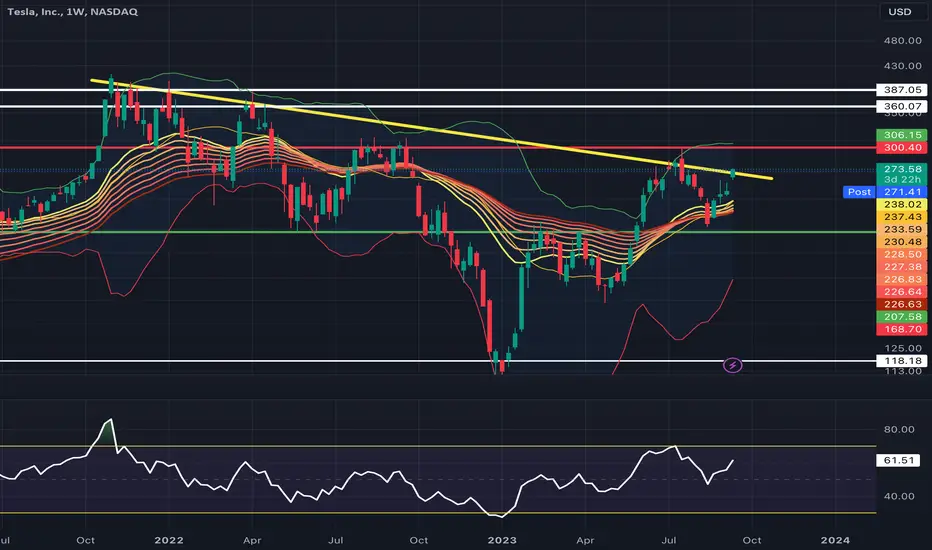
TSLA has reached the $270 price target (yellow resistance line). The next key price target is $300 where TSLA experienced strong selloff despite an excellent earnings report.
Key price levels to monitor:
(1) Red trendline - $300 resistance target
(2) White resistance zone between $360 and $387 near TSLA's all-time high
Technical Analysis Indicators:
- TSLA formed a bullish RSI bounce on the week of August 14 (40 RSI levels)
- This bounce occurred on the EMA ribbon and midrange of the Bollinger Band, which is also bullish
- The top of the Bollinger Band gives an estimated price target of $306.50 as a key resistance level, the Bollinger Bands will vary in price over time though.
Price Targets:
- $300-306 is my key short-term price target before considering the all-time high sell zone between $360-387.
Feragatname
Bilgiler ve yayınlar, TradingView tarafından sağlanan veya onaylanan finansal, yatırım, işlem veya diğer türden tavsiye veya tavsiyeler anlamına gelmez ve teşkil etmez. Kullanım Şartları'nda daha fazlasını okuyun.
Feragatname
Bilgiler ve yayınlar, TradingView tarafından sağlanan veya onaylanan finansal, yatırım, işlem veya diğer türden tavsiye veya tavsiyeler anlamına gelmez ve teşkil etmez. Kullanım Şartları'nda daha fazlasını okuyun.