Overview: let's review a few key points from the last update:
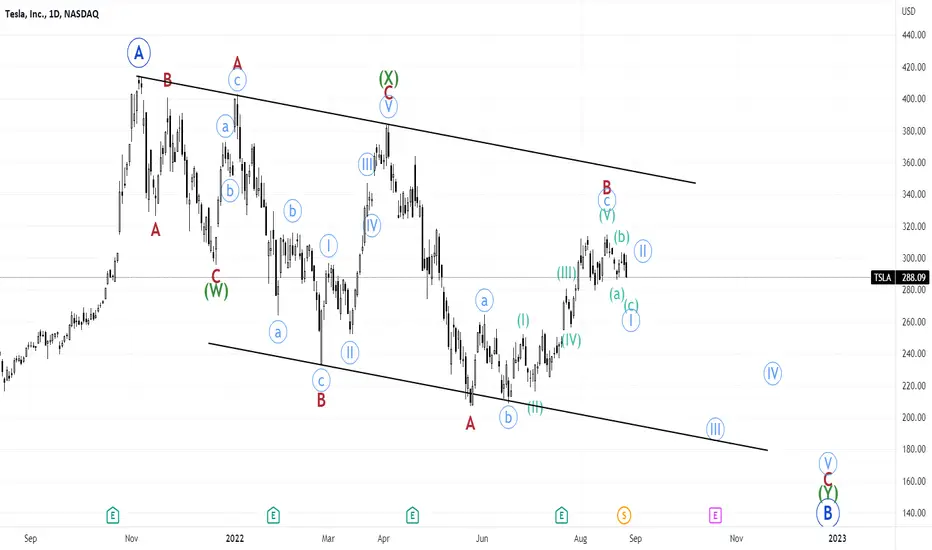
Update: I believe TSLA is close to the completion of wave I of C of (Y) of B. Based on the hourly chart, I see that wave III of (c) of I is almost complete and I expect the blue channel to hold the bottom of wave I (a potential target = 279.58), initiating the pullback for wave II.

Also note the formation of the head & shoulder pattern, with a price target of ~260.

- I see wave B of (Y) completed on TSLA and now we should start moving for leg C of (Y) of B.
- The daily chart also shows a double top forming, where a decisive daily close below the support area around 856 (285 post-split) confirms this scenario.
Update: I believe TSLA is close to the completion of wave I of C of (Y) of B. Based on the hourly chart, I see that wave III of (c) of I is almost complete and I expect the blue channel to hold the bottom of wave I (a potential target = 279.58), initiating the pullback for wave II.
Also note the formation of the head & shoulder pattern, with a price target of ~260.
İlgili yayınlar
Feragatname
Bilgiler ve yayınlar, TradingView tarafından sağlanan veya onaylanan finansal, yatırım, işlem veya diğer türden tavsiye veya tavsiyeler anlamına gelmez ve teşkil etmez. Kullanım Şartları'nda daha fazlasını okuyun.
İlgili yayınlar
Feragatname
Bilgiler ve yayınlar, TradingView tarafından sağlanan veya onaylanan finansal, yatırım, işlem veya diğer türden tavsiye veya tavsiyeler anlamına gelmez ve teşkil etmez. Kullanım Şartları'nda daha fazlasını okuyun.