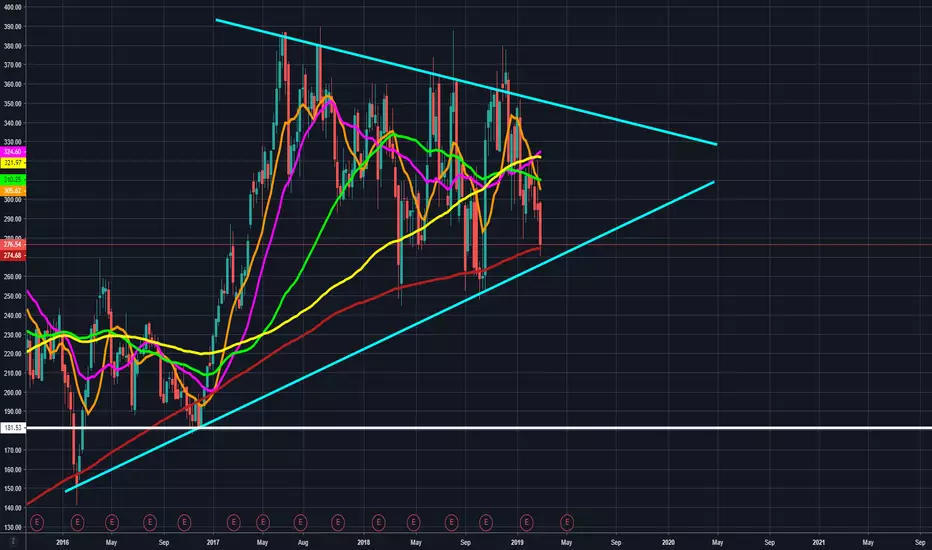
TSLA has had to go through a lot with all the news stories and FUD surrounding Elon Musk, and the stock price has suffered a bit. However, we are now sitting just above the 200 weekly moving average, and if if continues respecting this upward-sloping support (which is just below the 200 week moving average), TSLA has the potential to bounce up to higher levels. If we break the 200 weekly moving average and the rising line of support, then we could be setting up to see lower levels, but TSLA tends to be in its own category relative to other stocks and has held this symmetrical triangle pattern incredibly well for the last 3 years.
Moving average guide (All weekly moving averages for this post):
10 MA in Orange
20 MA in Pink
50 MA in Green
100 MA in Yellow
200 MA in Red
-This is not financial advice. Always do your own research and own due-diligence before investing and trading, as for investing and trading comes with high amounts of risk.
Not
Fib levels: FTX US: ftx.us/
Sign up for Binance US here: binance.us/?ref=35000668
Sign up for Binance US here: binance.us/?ref=35000668
Feragatname
Bilgiler ve yayınlar, TradingView tarafından sağlanan veya onaylanan finansal, yatırım, alım satım veya diğer türden tavsiye veya öneriler anlamına gelmez ve teşkil etmez. Kullanım Koşulları bölümünde daha fazlasını okuyun.
FTX US: ftx.us/
Sign up for Binance US here: binance.us/?ref=35000668
Sign up for Binance US here: binance.us/?ref=35000668
Feragatname
Bilgiler ve yayınlar, TradingView tarafından sağlanan veya onaylanan finansal, yatırım, alım satım veya diğer türden tavsiye veya öneriler anlamına gelmez ve teşkil etmez. Kullanım Koşulları bölümünde daha fazlasını okuyun.