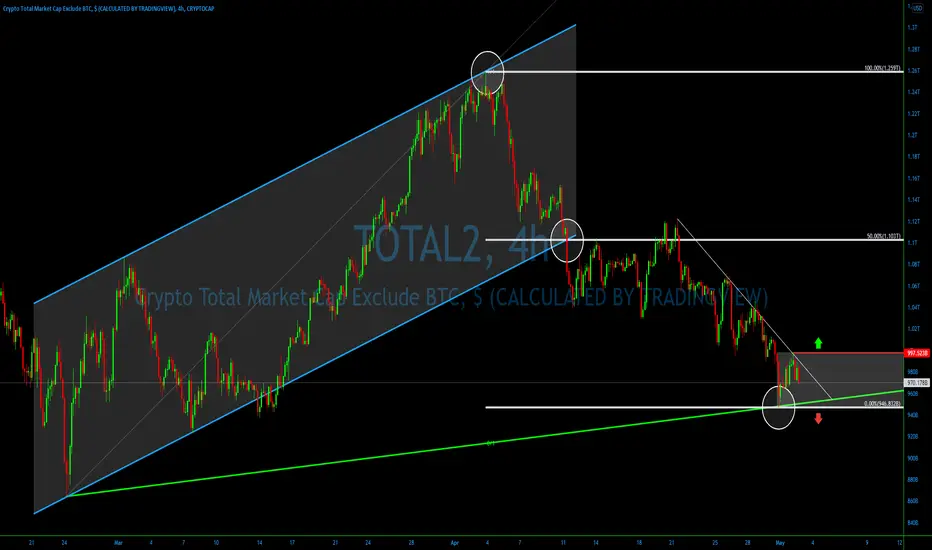
💎On April 30, TOTAL2 had reached and rejected two technical indicators at 966.832B. The first is an 8/1 Gann Fan trendline and the second is a 0% Fibonacci level. We applied the Fibonacci so that 50% is placed right at the ascending channel breakout point. This way, Fibs show that after the breakout, the price has dropped the same distance as the width of the channel.
💎After the bounce, TOTAL2 retraced up, but failed to break a simple downtrend trendline. For the time being, we are likely to witness a short-term consolidation, between the strong psychological resistance near 1.0T and technical support at 946B.
💎Bears remain in control as long as........
💎After the bounce, TOTAL2 retraced up, but failed to break a simple downtrend trendline. For the time being, we are likely to witness a short-term consolidation, between the strong psychological resistance near 1.0T and technical support at 946B.
💎Bears remain in control as long as........
Feragatname
Bilgiler ve yayınlar, TradingView tarafından sağlanan veya onaylanan finansal, yatırım, alım satım veya diğer türden tavsiye veya öneriler anlamına gelmez ve teşkil etmez. Kullanım Koşulları bölümünde daha fazlasını okuyun.
Feragatname
Bilgiler ve yayınlar, TradingView tarafından sağlanan veya onaylanan finansal, yatırım, alım satım veya diğer türden tavsiye veya öneriler anlamına gelmez ve teşkil etmez. Kullanım Koşulları bölümünde daha fazlasını okuyun.