🔥 Welcome FireHoseReel !
Let’s explore the latest TOTAL market setup.
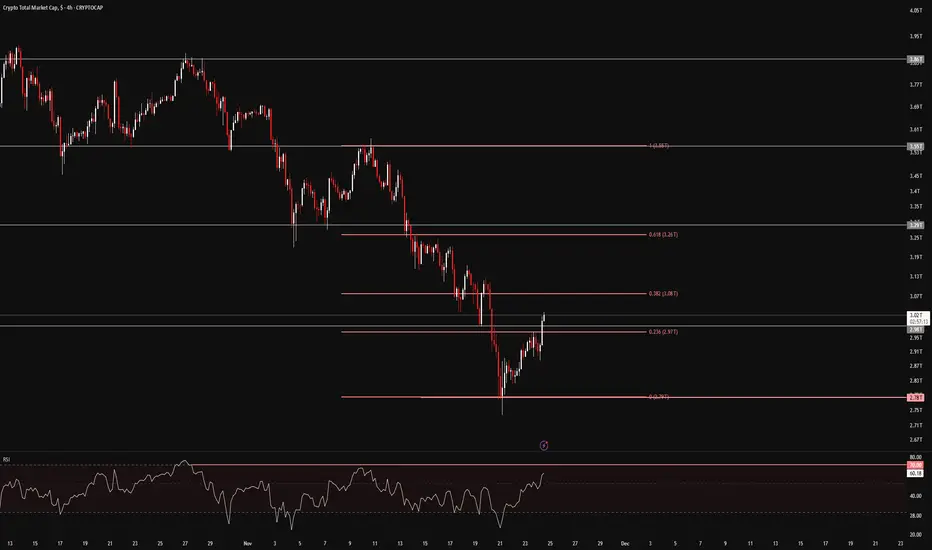
👀 TOTAL – 4H Timeframe Analysis
On the 4-hour chart, TOTAL shows the overall inflow of capital into the crypto market.
Price has successfully broken the 23% Fibonacci retracement level and is now moving toward the 38% zone.
If the 38% level breaks, traders who entered from lower supports can safely add to their position.
📊 RSI Momentum Check
The RSI has crossed above its previous high and has already moved above the 50 level, showing growing bullish momentum.
The next major RSI resistance sits around 70, which aligns perfectly with the 38% Fibonacci level, creating a strong confluence zone.
✔️ Correlation With Bitcoin
TOTAL shows a clear positive convergence with Bitcoin’s chart—both have built strong support levels and are pushing upward.
Institutional investors appear to have formed a solid accumulation base in this area, and the latest confirmations indicate this zone is becoming a reliable bottom.
With capital flowing into the crypto market and Bitcoin gaining momentum, the next moves across the market could be very powerful.
🛞 Risk Management & Disclaimer
Please remember to always use proper risk management and position sizing. Nothing in this analysis is financial advice. The market can change quickly, so always trade based on your own strategy, research, and risk tolerance. You are fully responsible for your own trades.
Let’s explore the latest TOTAL market setup.
👀 TOTAL – 4H Timeframe Analysis
On the 4-hour chart, TOTAL shows the overall inflow of capital into the crypto market.
Price has successfully broken the 23% Fibonacci retracement level and is now moving toward the 38% zone.
If the 38% level breaks, traders who entered from lower supports can safely add to their position.
📊 RSI Momentum Check
The RSI has crossed above its previous high and has already moved above the 50 level, showing growing bullish momentum.
The next major RSI resistance sits around 70, which aligns perfectly with the 38% Fibonacci level, creating a strong confluence zone.
✔️ Correlation With Bitcoin
TOTAL shows a clear positive convergence with Bitcoin’s chart—both have built strong support levels and are pushing upward.
Institutional investors appear to have formed a solid accumulation base in this area, and the latest confirmations indicate this zone is becoming a reliable bottom.
With capital flowing into the crypto market and Bitcoin gaining momentum, the next moves across the market could be very powerful.
🛞 Risk Management & Disclaimer
Please remember to always use proper risk management and position sizing. Nothing in this analysis is financial advice. The market can change quickly, so always trade based on your own strategy, research, and risk tolerance. You are fully responsible for your own trades.
🔥 Join the Action Now 🔥
☄️ Telegram
t.me/FireHoseReel
☄️ Trade & Earn
bitunix.com/register?inviteCode=28r21f
☄️ Telegram
t.me/FireHoseReel
☄️ Trade & Earn
bitunix.com/register?inviteCode=28r21f
İlgili yayınlar
Feragatname
Bilgiler ve yayınlar, TradingView tarafından sağlanan veya onaylanan finansal, yatırım, alım satım veya diğer türden tavsiye veya öneriler anlamına gelmez ve teşkil etmez. Kullanım Koşulları bölümünde daha fazlasını okuyun.