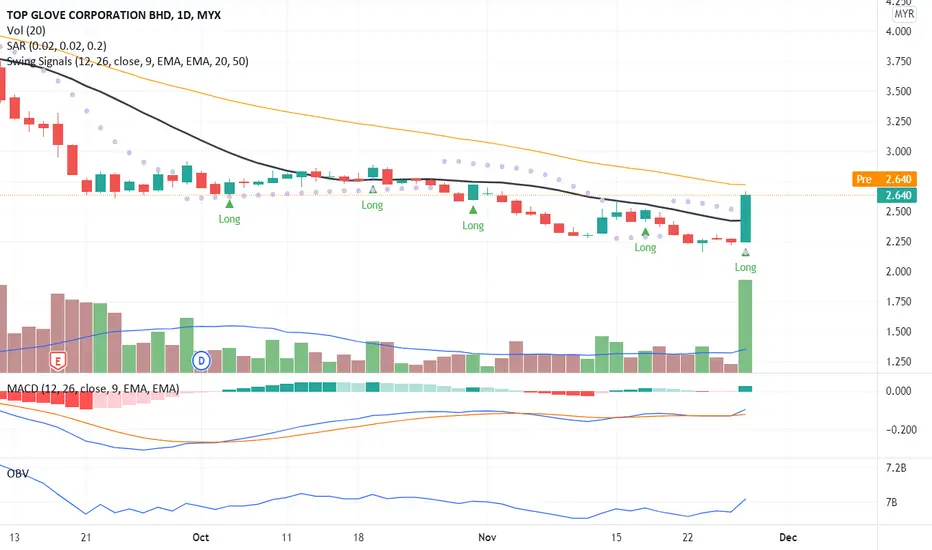
Significant price movement due to buying interest makes the candlestick close above MA20. Hence, creating a price breakout signal with big volumes confirmed the trend after side-way for several trades.
MACD and OBV charts indicate a divergence signal. Therefore, the a high possibility of a long trade position. Will TOPGLOV will be having a price correction or continue the price up momentum?
To place your bid, use VWAP as a guideline and place your bid below the VWAP line.
Put TOPGLOV in your WL and watch out for price rally-up momentum.
R 2.72
S 2.24
İlgili yayınlar
Feragatname
Bilgiler ve yayınlar, TradingView tarafından sağlanan veya onaylanan finansal, yatırım, alım satım veya diğer türden tavsiye veya öneriler anlamına gelmez ve teşkil etmez. Kullanım Koşulları bölümünde daha fazlasını okuyun.
İlgili yayınlar
Feragatname
Bilgiler ve yayınlar, TradingView tarafından sağlanan veya onaylanan finansal, yatırım, alım satım veya diğer türden tavsiye veya öneriler anlamına gelmez ve teşkil etmez. Kullanım Koşulları bölümünde daha fazlasını okuyun.