Price Action Analysis:
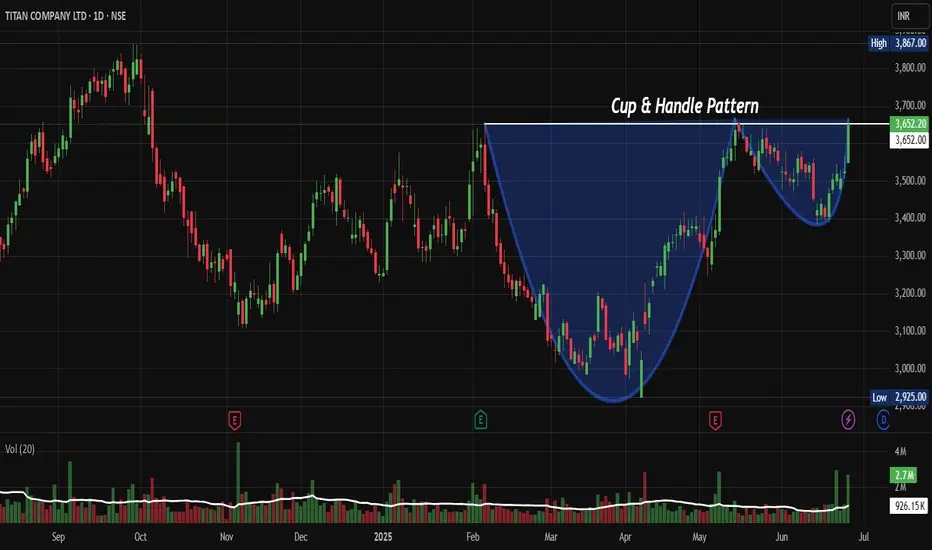
• Stock has formed a classic Cup & Handle pattern over an 8-month period from February 2025 to June 2025
• Cup formation shows a rounded bottom with depth of approximately 800 points (3,700 to 2,900 levels)
• Handle formation displays controlled consolidation with lower volatility, indicating institutional accumulation
• Price action demonstrates strong momentum with a 3.58% daily gain and healthy volume expansion
Volume Spread Analysis:
• Volume pattern confirms the Cup & Handle formation with classic volume characteristics
• During cup formation, volume contracted during the decline and expanded during recovery
• Handle formation shows diminishing volume, indicating reduced selling pressure
• Recent breakout accompanied by significant volume spike (2.7M vs average), confirming institutional participation
• Volume-price correlation remains positive, supporting the bullish breakout thesis
Key Technical Levels:
Support Levels:
• Primary Support: 3,500
• Secondary Support: 3,400
• Major Support: 3,200
Resistance Levels:
• Immediate Resistance: 3,700 (Previous highs and psychological level)
• Major Resistance: 3,867 (52 Week high marked on chart)
• Extended Target: 4,200 (Cup & Handle measured move target)
Technical Patterns Identified:
• Cup & Handle Pattern: Primary bullish continuation pattern spanning 5 months
• Ascending Triangle: Within the handle formation, showing higher lows
• Volume Accumulation Pattern: Consistent with institutional buying during consolidation phases
Trade Setup:
Entry Strategy:
• Primary Entry: 3,650-3,680 (Current levels on any minor pullback)
• Secondary Entry: 3,580-3,620
• Aggressive Entry: Market price for momentum traders
Exit Levels:
• Target 1: 3,800 (Near-term resistance, book 30% profits)
• Target 2: 3,950 (Previous highs breach, book 40% profits)
• Target 3: 4,200 (Cup & Handle measured move, remaining 30%)
Risk Management:
• Stop Loss: 3,480 (Below handle low with 5% buffer)
• Risk-Reward Ratio: 1:3 (Risk of 170 points vs reward of 500+ points to first major target)
• Maximum Risk per Trade: 2% of portfolio capital
Position Sizing:
• Conservative Approach: 1-1.5% of portfolio given the strong setup
• Moderate Approach: 2-2.5% for traders comfortable with mid-cap volatility
• Scale-in Strategy: 50% on initial entry, 30% on any dip to secondary entry, 20% on momentum confirmation
Sectoral and Fundamental Backdrop:
Sector Analysis:
• Consumer Discretionary sector showing resilience amid economic recovery
• Jewellery and watches segment benefiting from the wedding season demand and festival purchases
• Luxury consumption trends supporting the premium positioning of Titan's brands
• Rural demand recovery provides an additional growth catalyst for the company
Fundamental Highlights:
• Strong brand portfolio including Tanishq, Titan, Fastrack, and Sonata
• Consistent market share gains in the organised jewellery retail segment
• Digital transformation initiatives are improving operational efficiency
• Expansion in tier-2 and tier-3 cities driving geographical diversification
Macroeconomic Factors:
• Favourable gold price trends supporting jewellery business margins
• Rising disposable income in Indian households is boosting luxury spending
• The government's focus on organized retail supporting compliant players like Titan
• Wedding season and festival demand provide seasonal tailwinds
Key Risks to Monitor:
• Gold price volatility is impacting raw material costs and consumer demand
• Competition from online jewellery platforms and regional players
• Economic slowdown potentially affecting discretionary spending
• Regulatory changes in gold import duties or GST rates
My Take:
This technical setup presents a compelling risk-reward opportunity with the Cup & Handle pattern completion, strong volume confirmation, and favourable sectoral backdrop supporting the bullish thesis for Titan Company.
Keep in the Watchlist.
NO RECO. For Buy/Sell.
📌Thank you for exploring my idea! I hope you found it valuable.
🙏FOLLOW for more
👍BOOST if you found it useful.
✍️COMMENT below with your views.
Meanwhile, check out my other stock ideas on the right side until this trade is activated. I would love your feedback.
Disclaimer: "I am not a SEBI REGISTERED RESEARCH ANALYST AND INVESTMENT ADVISER."
This analysis is intended solely for informational and educational purposes and should not be interpreted as financial advice. It is advisable to consult a qualified financial advisor or conduct thorough research before making investment decisions.
İlgili yayınlar
Feragatname
Bilgiler ve yayınlar, TradingView tarafından sağlanan veya onaylanan finansal, yatırım, işlem veya diğer türden tavsiye veya tavsiyeler anlamına gelmez ve teşkil etmez. Kullanım Şartları'nda daha fazlasını okuyun.
İlgili yayınlar
Feragatname
Bilgiler ve yayınlar, TradingView tarafından sağlanan veya onaylanan finansal, yatırım, işlem veya diğer türden tavsiye veya tavsiyeler anlamına gelmez ve teşkil etmez. Kullanım Şartları'nda daha fazlasını okuyun.