TITAN COMPANY LTD (NSE:TITAN) - High Probability Reversal Setup
Weekly Timeframe Analysis | Potential Swing Trade Opportunity
▲ BULLISH CASE[/color]
Elliott Wave Structure:
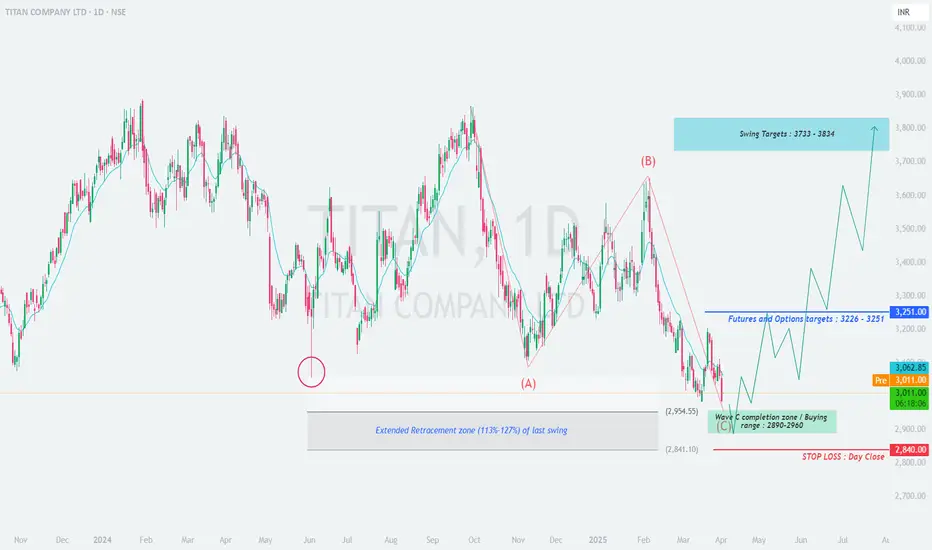
• Appears to be completing Wave C of correction (ABC pattern)
• Wave C = 1.272 extension of Wave A at ₹2,890-2,960 zone
• Typical reversal area for such corrections
Technical Confluences:
• [u]Fibonacci Support:[/u]
1.127-1.272 retracement of prior uptrend
Aligns with 2023 swing high area
• [u]Volume Profile:[/u]
High volume node at ₹2,920
Declining volume on recent downmove
Pattern Recognition:
• Potential falling wedge (bullish)
• RSI(14) weekly showing bullish divergence
• MACD histogram flattening near lows
▼ RISK FACTORS[/color]
• Breakdown below ₹2,840 invalidates setup
• Broader market weakness could delay recovery
• FIIs reducing positions in consumer sector
📊 Trade Plan
📌 Key Levels
[table]
[tr]
[td]Support[/td]
[td]Resistance[/td]
[/tr]
[tr]
[td]₹2,960 (immediate)[/td]
[td]₹3,100 (200 DMA)[/td]
[/tr]
[tr]
[td]₹2,890 (strong)[/td]
[td]₹3,226 (F&O OI peak)[/td]
[/tr]
[tr]
[td]₹2,840 (absolute)[/td]
[td]₹3,733 (ATH)[/td]
[/tr]
[/table]
💡 Additional Notes:
• Watch for bullish reversal candle patterns in the zone
• FII derivative data shows put writing at ₹2,900 strike
• Consumer sector showing relative strength vs Nifty
Would you take this trade? Discuss in comments!
#TITAN,#NSE,#swingtrading,#elliottwave,#technicalanalysis
Weekly Timeframe Analysis | Potential Swing Trade Opportunity
▲ BULLISH CASE[/color]
Elliott Wave Structure:
• Appears to be completing Wave C of correction (ABC pattern)
• Wave C = 1.272 extension of Wave A at ₹2,890-2,960 zone
• Typical reversal area for such corrections
Technical Confluences:
• [u]Fibonacci Support:[/u]
1.127-1.272 retracement of prior uptrend
Aligns with 2023 swing high area
• [u]Volume Profile:[/u]
High volume node at ₹2,920
Declining volume on recent downmove
Pattern Recognition:
• Potential falling wedge (bullish)
• RSI(14) weekly showing bullish divergence
• MACD histogram flattening near lows
▼ RISK FACTORS[/color]
• Breakdown below ₹2,840 invalidates setup
• Broader market weakness could delay recovery
• FIIs reducing positions in consumer sector
📊 Trade Plan
- []Entry Zone: ₹2,890-2,960 (scale-in approach recommended)
[]Stop Loss: Daily close below ₹2,840 (absolute) - Targets:
T1: ₹3,226 (61.8% retrace)
T2: ₹3,733 (previous high)
T3: ₹3,834 (127% extension) - Timeframe: 8-12 week hold for full targets
📌 Key Levels
[table]
[tr]
[td]Support[/td]
[td]Resistance[/td]
[/tr]
[tr]
[td]₹2,960 (immediate)[/td]
[td]₹3,100 (200 DMA)[/td]
[/tr]
[tr]
[td]₹2,890 (strong)[/td]
[td]₹3,226 (F&O OI peak)[/td]
[/tr]
[tr]
[td]₹2,840 (absolute)[/td]
[td]₹3,733 (ATH)[/td]
[/tr]
[/table]
💡 Additional Notes:
• Watch for bullish reversal candle patterns in the zone
• FII derivative data shows put writing at ₹2,900 strike
• Consumer sector showing relative strength vs Nifty
Would you take this trade? Discuss in comments!
#TITAN,#NSE,#swingtrading,#elliottwave,#technicalanalysis
İşlem aktif
Trading near Swing Target, predicted at perfect bottomİşlem kapandı: hedefe ulaştı
Well predicted bottom and reaching at target nowFeragatname
Bilgiler ve yayınlar, TradingView tarafından sağlanan veya onaylanan finansal, yatırım, alım satım veya diğer türden tavsiye veya öneriler anlamına gelmez ve teşkil etmez. Kullanım Koşulları bölümünde daha fazlasını okuyun.
Feragatname
Bilgiler ve yayınlar, TradingView tarafından sağlanan veya onaylanan finansal, yatırım, alım satım veya diğer türden tavsiye veya öneriler anlamına gelmez ve teşkil etmez. Kullanım Koşulları bölümünde daha fazlasını okuyun.