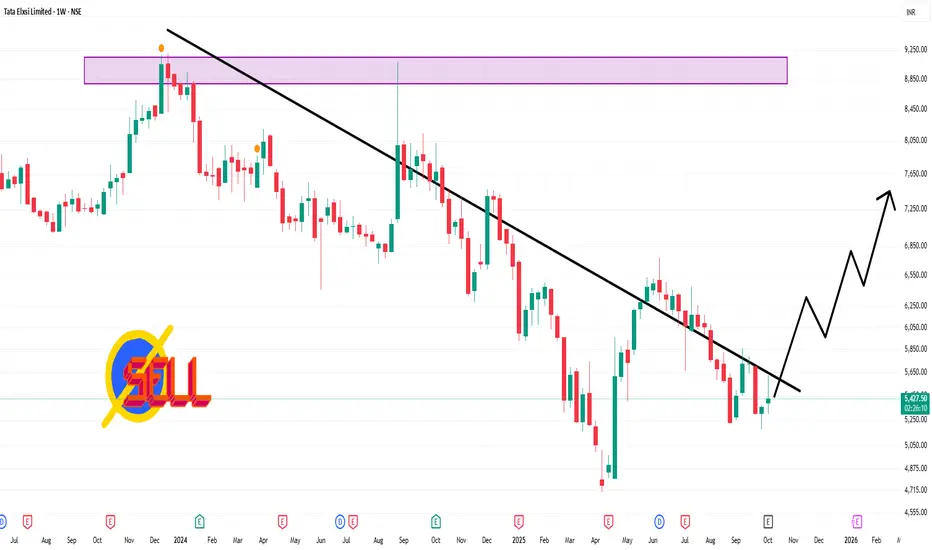
📉 Technical Outlook (Weekly Timeframe)
Technical Rating: The prevailing trend is a strong sell, supported by indicators such as moving averages and oscillators.
Pivot Levels:
Weekly Pivot Point: ₹5,300.33
Support Levels:
S1: ₹5,272.75
S2: ₹5,106.83
Resistance Levels:
R1: ₹5,493.83
R2: ₹5,618.17
Central Pivot Range: ₹5,272.75 – ₹5,300.33 – ₹5,327.92
Relative Strength Index (RSI): The 14-day RSI is approximately 48.6, indicating a neutral condition.
Moving Averages:
50-day MA: ₹5,362.89 (Buy)
200-day MA: ₹5,503.06 (Sell)
5-day MA: ₹5,468.50 (Sell)
10-day MA: ₹5,502.65 (Sell)
20-day MA: ₹5,468.57 (Sell)
İlgili yayınlar
Feragatname
Bilgiler ve yayınlar, TradingView tarafından sağlanan veya onaylanan finansal, yatırım, alım satım veya diğer türden tavsiye veya öneriler anlamına gelmez ve teşkil etmez. Kullanım Koşulları bölümünde daha fazlasını okuyun.
İlgili yayınlar
Feragatname
Bilgiler ve yayınlar, TradingView tarafından sağlanan veya onaylanan finansal, yatırım, alım satım veya diğer türden tavsiye veya öneriler anlamına gelmez ve teşkil etmez. Kullanım Koşulları bölümünde daha fazlasını okuyun.