TAO Chart Analysis
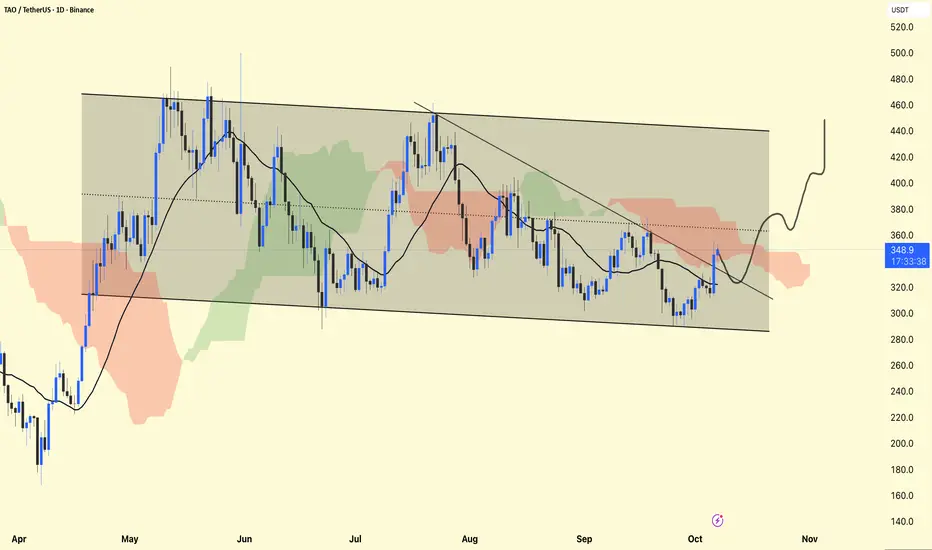
Overall Structure: The price is moving within a descending channel (marked by the shaded area). This reflects a broader bearish trend over the past several months.
Short-Term Momentum: Recently, the price has bounced off the lower channel boundary around $300 and is attempting to break the short-term downtrend line.
Support and Resistance
Support Levels:
~$320 (recent consolidation and channel bottom area)
~$300 (strong lower channel boundary)
Resistance Levels:
~$360 (current short-term downtrend line and Ichimoku Cloud resistance)
~$400 (upper channel boundary)
~$440–450 (previous highs, upper channel line)
Ichimoku Cloud:
Currently, the price is entering the red cloud – a potential resistance area.
If the price closes above the cloud (~$360–370), it could signal a trend reversal.
Moving Averages: The price is slightly above the short-term moving averages, which indicates a near-term uptrend.
The projection shown shows a potential breakout above the descending channel, initially targeting the $400–420 area.
A successful breakout accompanied by broad volume could shift the medium-term trend from bearish to bullish.
DYOR | NFA
İlgili yayınlar
Feragatname
Bilgiler ve yayınlar, TradingView tarafından sağlanan veya onaylanan finansal, yatırım, işlem veya diğer türden tavsiye veya tavsiyeler anlamına gelmez ve teşkil etmez. Kullanım Şartları'nda daha fazlasını okuyun.
İlgili yayınlar
Feragatname
Bilgiler ve yayınlar, TradingView tarafından sağlanan veya onaylanan finansal, yatırım, işlem veya diğer türden tavsiye veya tavsiyeler anlamına gelmez ve teşkil etmez. Kullanım Şartları'nda daha fazlasını okuyun.