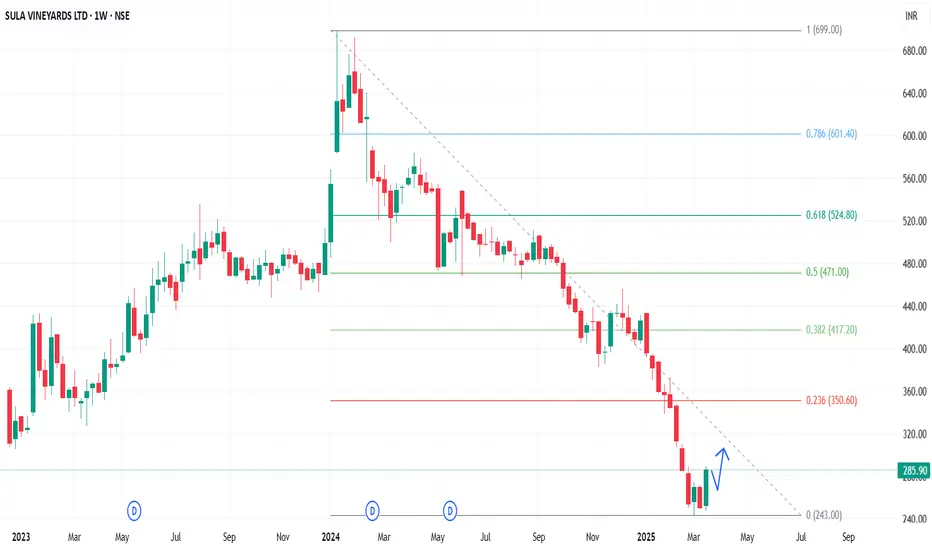
In the Weekly Chart of SULA ,
we can see that; it is showing a W shape recovery from 240-245 level.
wait for a Halt or retrace candle and then enter with SL and Targets.
Expected momentum is shared in chart.
we can see that; it is showing a W shape recovery from 240-245 level.
wait for a Halt or retrace candle and then enter with SL and Targets.
Expected momentum is shared in chart.
Feragatname
Bilgiler ve yayınlar, TradingView tarafından sağlanan veya onaylanan finansal, yatırım, alım satım veya diğer türden tavsiye veya öneriler anlamına gelmez ve teşkil etmez. Kullanım Koşulları bölümünde daha fazlasını okuyun.
Feragatname
Bilgiler ve yayınlar, TradingView tarafından sağlanan veya onaylanan finansal, yatırım, alım satım veya diğer türden tavsiye veya öneriler anlamına gelmez ve teşkil etmez. Kullanım Koşulları bölümünde daha fazlasını okuyun.