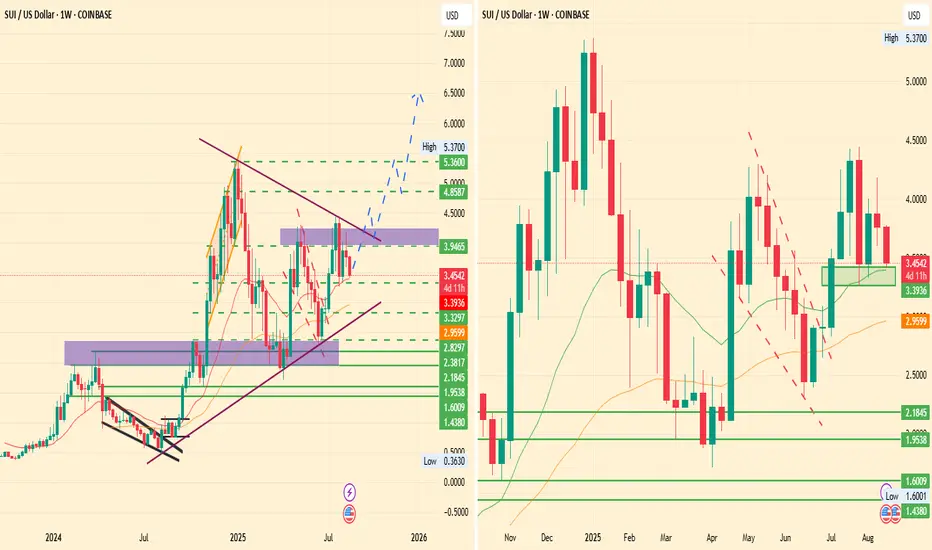
In the current quarter, July brought bullish demand, where this symmetrical pattern played its role on the weekly chart as the SUI price USD reflected a sharp rise from the lower border of this triangle to the upper edge, marking a 90% surge from $2.29 to $4.42.
Yet, August brought a pullback toward a key support level near $3.32. If this zone holds and bullish demand steps in, analysts anticipate a retest of the upper border of the pattern.
A successful breakout could send the SUI price forecast toward $5.37 in the coming weeks.
this retest in Q3 will be followed by an extended rally toward the $6.6 to $7.0 region in Q4 2025.
Feragatname
Bilgiler ve yayınlar, TradingView tarafından sağlanan veya onaylanan finansal, yatırım, alım satım veya diğer türden tavsiye veya öneriler anlamına gelmez ve teşkil etmez. Kullanım Koşulları bölümünde daha fazlasını okuyun.
Feragatname
Bilgiler ve yayınlar, TradingView tarafından sağlanan veya onaylanan finansal, yatırım, alım satım veya diğer türden tavsiye veya öneriler anlamına gelmez ve teşkil etmez. Kullanım Koşulları bölümünde daha fazlasını okuyun.