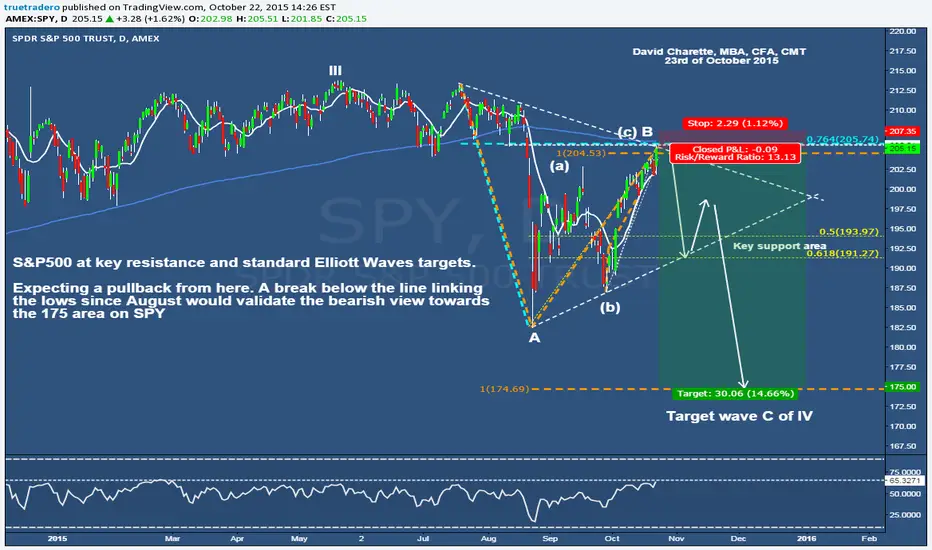
The S&P500 is at key graphical resistance (line linking the tops) and standard Elliott Waves targets.
RSI-14 Daily is at resistance also.
A break below the line linking the lows since August would validate the bearish count towards the 175 area on SPY.
A daily close above 207.35 would invalidate this view.
RSI-14 Daily is at resistance also.
A break below the line linking the lows since August would validate the bearish count towards the 175 area on SPY.
A daily close above 207.35 would invalidate this view.
Feragatname
Bilgiler ve yayınlar, TradingView tarafından sağlanan veya onaylanan finansal, yatırım, işlem veya diğer türden tavsiye veya tavsiyeler anlamına gelmez ve teşkil etmez. Kullanım Şartları'nda daha fazlasını okuyun.
Feragatname
Bilgiler ve yayınlar, TradingView tarafından sağlanan veya onaylanan finansal, yatırım, işlem veya diğer türden tavsiye veya tavsiyeler anlamına gelmez ve teşkil etmez. Kullanım Şartları'nda daha fazlasını okuyun.