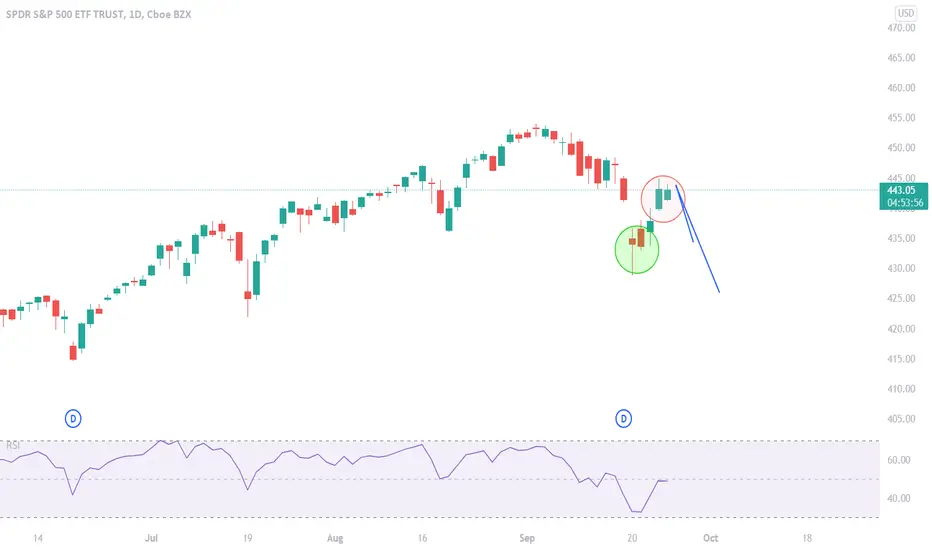
SPY - Bearish Harami - Short

SPY (SP500) hit the bottom of a short term candlestick pattern with a bullish Harami - which means the candlesticks when downwards, but the next day, the candle stayed within the previous days body. This is a candlestick reversal pattern, and it honestly depends how long it would go for. In this case, its only short term. I don't imagine we will top out over our pevious highs, but we still can..
In a similar pattern today, we have a Bearish Harami, which shows the green candlesticks going up, but our last green candlestick remains within the previous days body. This is a pretty good time to call a reversal (not long term trend reversal, but only short term - there are plenty of smaller trends that play in the overall scheme).
I expect this to lead to a newer low, below the $428.50 candle. It can consolidate short term, but let's see what were playing with, and read them a little at a time.
Feragatname
Bilgiler ve yayınlar, TradingView tarafından sağlanan veya onaylanan finansal, yatırım, işlem veya diğer türden tavsiye veya tavsiyeler anlamına gelmez ve teşkil etmez. Kullanım Şartları'nda daha fazlasını okuyun.
Feragatname
Bilgiler ve yayınlar, TradingView tarafından sağlanan veya onaylanan finansal, yatırım, işlem veya diğer türden tavsiye veya tavsiyeler anlamına gelmez ve teşkil etmez. Kullanım Şartları'nda daha fazlasını okuyun.