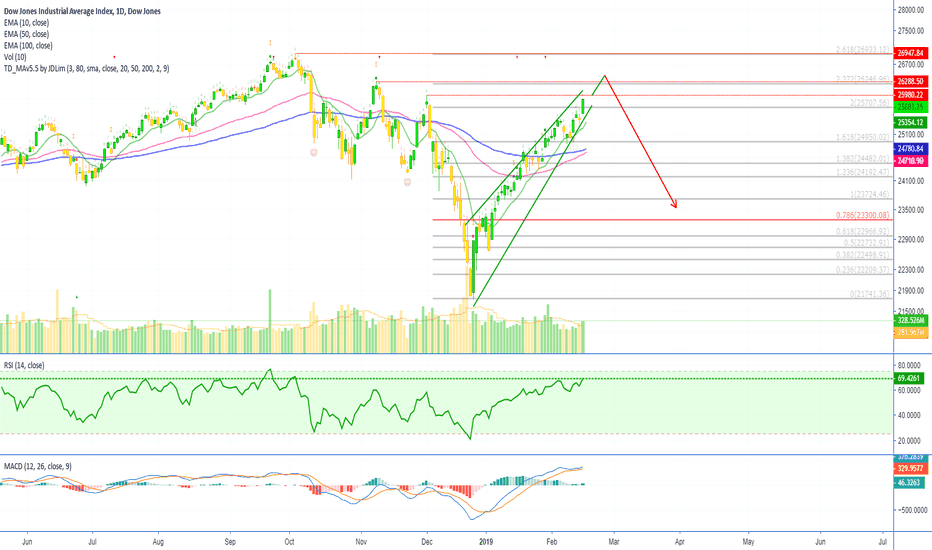
S&P 500 Index Will Crash... Again! (Bearish Divergence)

Back in October 2018 I shared a chart for SPX mentioning that it would crash, the signals were pretty straight forward and I was surprised to see how easy it is to predict movements of these conventional assets.
The crash followed as predicted. You can see it here:
Now, I am seeing the same signals that alerted me of the previews crash; here they are:
You can expect the S&P 500 Index to crash once more.
This is just a friendly reminder. We focus and trade mostly cryptocurrency, but many of our followers might get trapped by the hype that is shared daily on the news.
So get ready, as this will fall. SELL.
Hit LIKE to show your support.
Namaste.
The crash followed as predicted. You can see it here:

Now, I am seeing the same signals that alerted me of the previews crash; here they are:
- Bearish divergence on both the RSI and MACD.
- Not enough volume.
You can expect the S&P 500 Index to crash once more.
This is just a friendly reminder. We focus and trade mostly cryptocurrency, but many of our followers might get trapped by the hype that is shared daily on the news.
So get ready, as this will fall. SELL.
Hit LIKE to show your support.
Namaste.
Feragatname
Bilgiler ve yayınlar, TradingView tarafından sağlanan veya onaylanan finansal, yatırım, işlem veya diğer türden tavsiye veya tavsiyeler anlamına gelmez ve teşkil etmez. Kullanım Şartları'nda daha fazlasını okuyun.

