Good day ladies and gents,
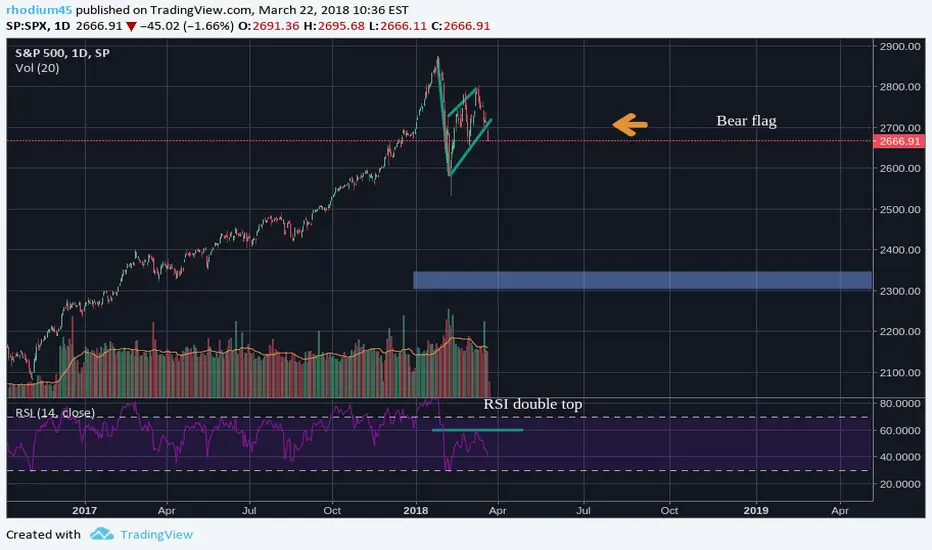
this is my first technical analysis on the SPX and it's clearly not a bullish one. The SPX had an astonishing bullrun over the recent years but a bear flag is marking its end. A double top formed on the RSI(14) indicator which only confirms the bearish breakout. The blue box on the chart acts a support and first target.
Keep in mind that I'm still a novice to TA and don't know too much about it. Feedback, be it positive or negative is very welcome.
Cheers
Feragatname
Bilgiler ve yayınlar, TradingView tarafından sağlanan veya onaylanan finansal, yatırım, işlem veya diğer türden tavsiye veya tavsiyeler anlamına gelmez ve teşkil etmez. Kullanım Şartları'nda daha fazlasını okuyun.
Feragatname
Bilgiler ve yayınlar, TradingView tarafından sağlanan veya onaylanan finansal, yatırım, işlem veya diğer türden tavsiye veya tavsiyeler anlamına gelmez ve teşkil etmez. Kullanım Şartları'nda daha fazlasını okuyun.
