SPX — WEEK 49 COVERAGE INITIATED | 12/05/2025
Ticker: SPX
SPX
Timeframe: W
This is a reactive structural classification of SPX based on the weekly chart as of this timestamp. Price conditions are evaluated as they stand — nothing here is predictive or forward-assumptive.
⸻
Author’s Note — Personal Position Update
I initiated my own position on [SPX] during Week [49], entering at $[6,870.39]. This decision follows my personal criteria: I only participate when my system identifies a verified structural trend shift supported by both a confirmed weekly flag and a qualifying candle state. This note reflects my activity only and is not a suggestion for anyone else.
As of this update, my position is currently up ~[0%] from my entry. My structural exit level is $[6,721.13] on a weekly-close basis. This level will continue to adjust upward automatically as the structure strengthens. If price closes below that threshold, my system classifies the trend as structurally compromised, and that is where I personally exit.
This update exists solely to document my own participation and the structural levels I monitor. It is not predictive and does not imply any future outcome.
⸻
Structural Integrity
1) Current Trend Condition [Numbers to Watch]
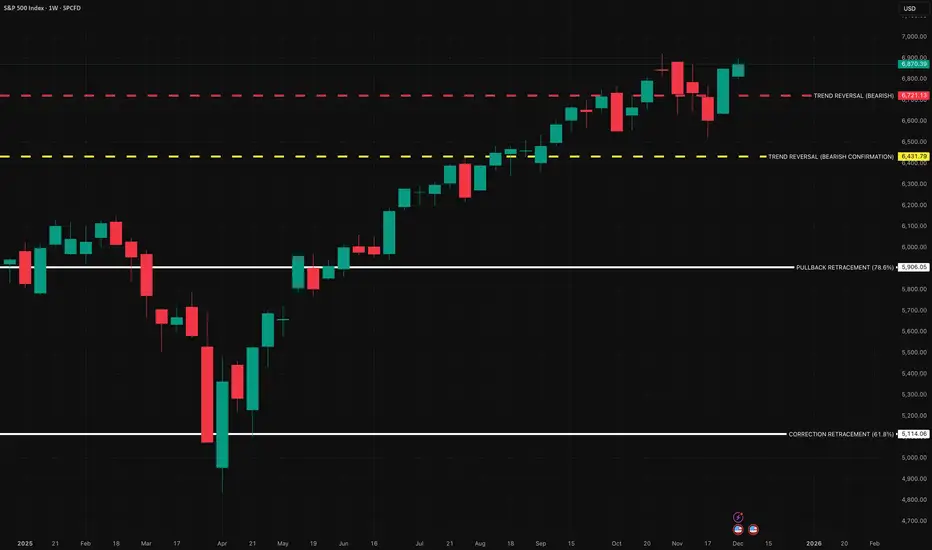
Current Price @ $[6,870.39]
• Trend Duration @ +2 Weeks
(Bullish ) [0% from my entry]
• Trend Reversal Level (Bearish ) @ $[6,721.13]
• Trend Reversal Level (Bearish Confirmation ) @ $[6,431.79]
• Pullback Retracement @ $[5,906]
• Correction Support @ $[5,114]
⸻
2) Structure Health
• Retracement Phase:
Uptrend (operating above 78.6%)
• Position Status:
Healthy (price above both structural layers)
⸻
3) Temperature:
Warming Phase
⸻
4) Momentum:
Bullish
⸻
Structural Integrity
UPWARD STRUCTURAL ALIGNMENT
This mark reflects a point where market behavior supported the continuation of the existing upward direction. It does not imply forecasting or targets — it simply notes where strength became observable within the current trend. Its meaning holds only while price continues to respect the broader structural levels that define the trend.
⸻
Methodology Overview
This classification framework evaluates directional conditions using internal trend-interpretation logic that references price behavior relative to its structural layers. These relationships are used to identify when price movement aligns with the framework’s criteria for directional phases, transition points, or regime shifts. Visual elements or structural labels reflect these internal interpretations, rather than explicit trading signals or preset indicator crossovers. This framework is observational only and does not imply future outcomes.
Ticker:
Timeframe: W
This is a reactive structural classification of SPX based on the weekly chart as of this timestamp. Price conditions are evaluated as they stand — nothing here is predictive or forward-assumptive.
⸻
Author’s Note — Personal Position Update
I initiated my own position on [
As of this update, my position is currently up ~[0%] from my entry. My structural exit level is $[6,721.13] on a weekly-close basis. This level will continue to adjust upward automatically as the structure strengthens. If price closes below that threshold, my system classifies the trend as structurally compromised, and that is where I personally exit.
This update exists solely to document my own participation and the structural levels I monitor. It is not predictive and does not imply any future outcome.
⸻
Structural Integrity
1) Current Trend Condition [Numbers to Watch]
Current Price @ $[6,870.39]
• Trend Duration @ +2 Weeks
(Bullish ) [0% from my entry]
• Trend Reversal Level (Bearish ) @ $[6,721.13]
• Trend Reversal Level (Bearish Confirmation ) @ $[6,431.79]
• Pullback Retracement @ $[5,906]
• Correction Support @ $[5,114]
⸻
2) Structure Health
• Retracement Phase:
Uptrend (operating above 78.6%)
• Position Status:
Healthy (price above both structural layers)
⸻
3) Temperature:
Warming Phase
⸻
4) Momentum:
Bullish
⸻
Structural Integrity
UPWARD STRUCTURAL ALIGNMENT
This mark reflects a point where market behavior supported the continuation of the existing upward direction. It does not imply forecasting or targets — it simply notes where strength became observable within the current trend. Its meaning holds only while price continues to respect the broader structural levels that define the trend.
⸻
Methodology Overview
This classification framework evaluates directional conditions using internal trend-interpretation logic that references price behavior relative to its structural layers. These relationships are used to identify when price movement aligns with the framework’s criteria for directional phases, transition points, or regime shifts. Visual elements or structural labels reflect these internal interpretations, rather than explicit trading signals or preset indicator crossovers. This framework is observational only and does not imply future outcomes.
GURULifeline — Advanced Trend System (Free Access)
Weekly SPX/QQQ Video Reports:
youtube.com/@GURULifeline
All GURULifeline indicators are FREE during beta.
DM for invite-only access.
Weekly SPX/QQQ Video Reports:
youtube.com/@GURULifeline
All GURULifeline indicators are FREE during beta.
DM for invite-only access.
İlgili yayınlar
Feragatname
Bilgiler ve yayınlar, TradingView tarafından sağlanan veya onaylanan finansal, yatırım, alım satım veya diğer türden tavsiye veya öneriler anlamına gelmez ve teşkil etmez. Kullanım Koşulları bölümünde daha fazlasını okuyun.