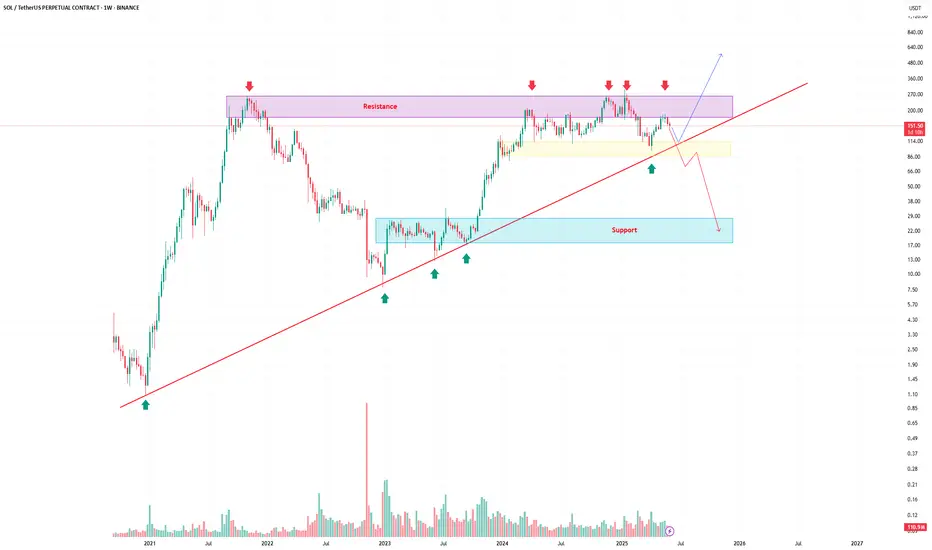
Solana is currently testing a key resistance zone (highlighted in purple), which has rejected the price multiple times in the recent past. At the same time, it continues to respect a well-defined ascending trendline, indicating building bullish pressure.
The blue zone marks an important horizontal support level, which served as the base for the previous breakout.
This chart is displayed in logarithmic view to better capture percentage-based price movements over time.
At the moment, price is being squeezed between:
the static resistance zone (seller area)
the rising trendline (buyer pressure)
What to watch for?
Break above resistance = potential bullish continuation
Break below trendline = possible retracement to support area
What do you think will happen next? Are you bullish or bearish on Solana?
Let me know in the comments!
If you enjoyed this post, feel free to share it with your friends!
Thank you!
#Solana #SOLUSDT #CryptoTrading #TechnicalAnalysis #LogChart #PriceAction #Breakout #SupportResistance #TradingView #Altcoins
🚀Get free crypto signals, strategies, market insights & tools I personally use.
📌 t.me/cryptolvke
📌 t.me/cryptolvke
Feragatname
Bilgiler ve yayınlar, TradingView tarafından sağlanan veya onaylanan finansal, yatırım, işlem veya diğer türden tavsiye veya tavsiyeler anlamına gelmez ve teşkil etmez. Kullanım Şartları'nda daha fazlasını okuyun.