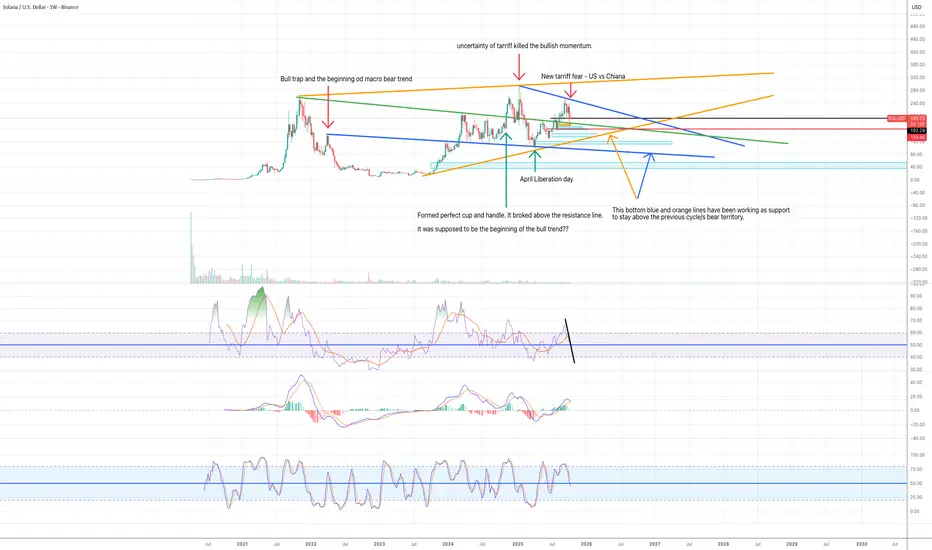
I can see a few patterns in a weekly chart.
1) The price is moving inside the blue descending wedge pattern.
2) The price is moving inside the orange ascending wedge pattern.
3) Green descending support/resistance line is the line that completes a huge cup and handle pattern.
What do you think? I would like to know what others see.
Have a nice weekend.
İlgili yayınlar
Feragatname
Bilgiler ve yayınlar, TradingView tarafından sağlanan veya onaylanan finansal, yatırım, alım satım veya diğer türden tavsiye veya öneriler anlamına gelmez ve teşkil etmez. Kullanım Koşulları bölümünde daha fazlasını okuyun.
İlgili yayınlar
Feragatname
Bilgiler ve yayınlar, TradingView tarafından sağlanan veya onaylanan finansal, yatırım, alım satım veya diğer türden tavsiye veya öneriler anlamına gelmez ve teşkil etmez. Kullanım Koşulları bölümünde daha fazlasını okuyun.