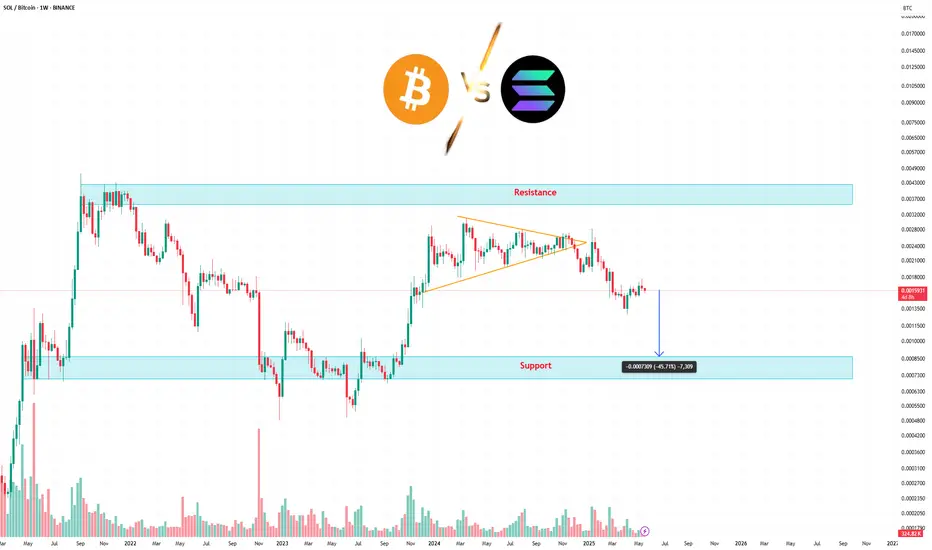
The chart shows a clear weakening of Solana against Bitcoin. After a prolonged sideways phase within a symmetrical triangle, price has broken down, signaling a potential bearish continuation.
🔻 Technical pattern:
Well-defined symmetrical triangle (orange lines) broken to the downside.
Breakdown occurred with rising volume, confirming the validity of the move.
📌 Key levels:
Resistance: 0.00370 – 0.00430 BTC (strong supply zone, repeatedly rejected).
Support: 0.00073 – 0.00110 BTC (historical potential bounce zone).
Price is currently heading toward support, with a theoretical target around 0.00110 BTC, in line with the triangle’s height.
📊 Volume:
Gradual decline during the triangle formation.
Volume spike on breakdown – a confirmation signal.
⚠️ Observations:
The SOL/BTC pair is showing clear relative weakness vs BTC.
If the highlighted support zone fails to hold, new local lows may be in sight.
Potential reversal signals would require a reclaim of resistance or evident accumulation near support.
🚀Get free signals, strategies, market insights & tools I use.
📌 Telegram Channel : t.me/cryptolvke
📌Free Crypto Strategy : bit.ly/SolStrategy
📌 Shop : beacons.ai/cryptoluke
📌 Support : t.me/CryptoLukeSupport
📌 Telegram Channel : t.me/cryptolvke
📌Free Crypto Strategy : bit.ly/SolStrategy
📌 Shop : beacons.ai/cryptoluke
📌 Support : t.me/CryptoLukeSupport
Feragatname
Bilgiler ve yayınlar, TradingView tarafından sağlanan veya onaylanan finansal, yatırım, alım satım veya diğer türden tavsiye veya öneriler anlamına gelmez ve teşkil etmez. Kullanım Koşulları bölümünde daha fazlasını okuyun.