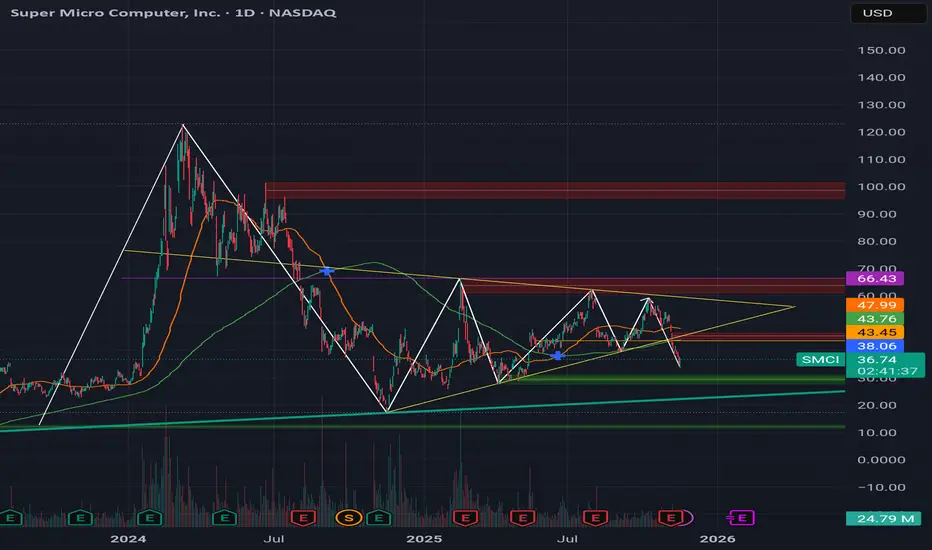
I see a HUGE symmetrical triangle pattern with a HUGE fakeout on a daily chart.
Past few years, SMCI has always been at its yearly lowest in November time frame, and then it shoots up towards the end of year. Check it out yourself.
Recent A.I. bubble fears have given us amazing discount (the huge fakeout).
I know SMCI almost always does not act accordingly to conventional analysis we anticipate and this time is no exception. If this heads lower again,- perhaps down to sub-$30(?), I am going to fully commit for Christmas present.
My target is $66 by the end of the year :)
Good luck out there, everyone.
Feragatname
Bilgiler ve yayınlar, TradingView tarafından sağlanan veya onaylanan finansal, yatırım, alım satım veya diğer türden tavsiye veya öneriler anlamına gelmez ve teşkil etmez. Kullanım Koşulları bölümünde daha fazlasını okuyun.
Feragatname
Bilgiler ve yayınlar, TradingView tarafından sağlanan veya onaylanan finansal, yatırım, alım satım veya diğer türden tavsiye veya öneriler anlamına gelmez ve teşkil etmez. Kullanım Koşulları bölümünde daha fazlasını okuyun.