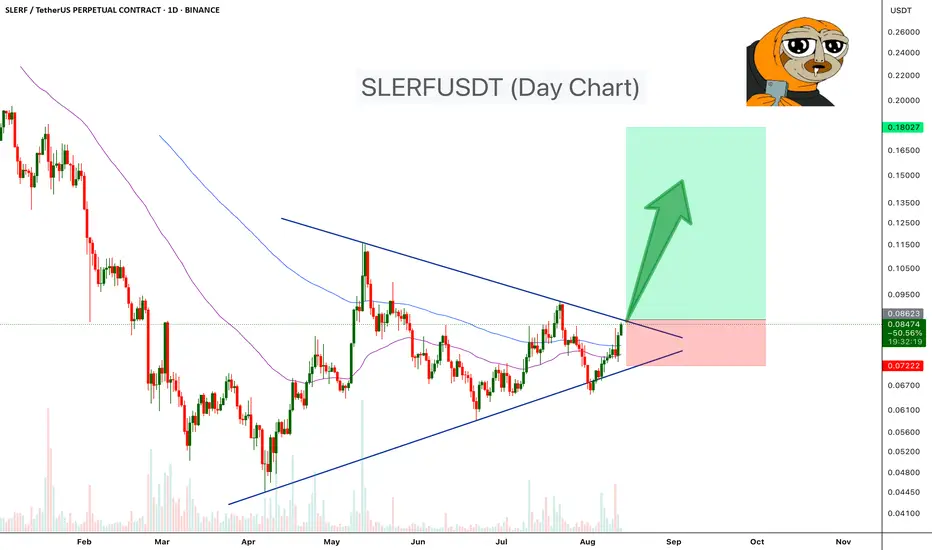
SLERFUSDT has been trading inside a symmetrical triangle formation on the daily chart since April 2025, with higher lows meeting lower highs as price coils toward the apex. This tightening price action often leads to a decisive breakout in either direction once volatility returns.
Currently, SLERF is testing the triangle’s upper trendline near the $0.086 level. A decisive daily close above this resistance, backed by strong volume, would confirm a bullish breakout, potentially opening upside toward $0.105, $0.135, and $0.18.
Cheers
Hexa
Currently, SLERF is testing the triangle’s upper trendline near the $0.086 level. A decisive daily close above this resistance, backed by strong volume, would confirm a bullish breakout, potentially opening upside toward $0.105, $0.135, and $0.18.
Cheers
Hexa
🚀Telegram : t.me/hexatrades
🌐Website: hexatrades.io/
🗣️Twitter(X): twitter.com/HexaTrades
🌐Website: hexatrades.io/
🗣️Twitter(X): twitter.com/HexaTrades
İlgili yayınlar
Feragatname
Bilgiler ve yayınlar, TradingView tarafından sağlanan veya onaylanan finansal, yatırım, işlem veya diğer türden tavsiye veya tavsiyeler anlamına gelmez ve teşkil etmez. Kullanım Şartları'nda daha fazlasını okuyun.
