Alış
SINA Flag possible parabolic breakout
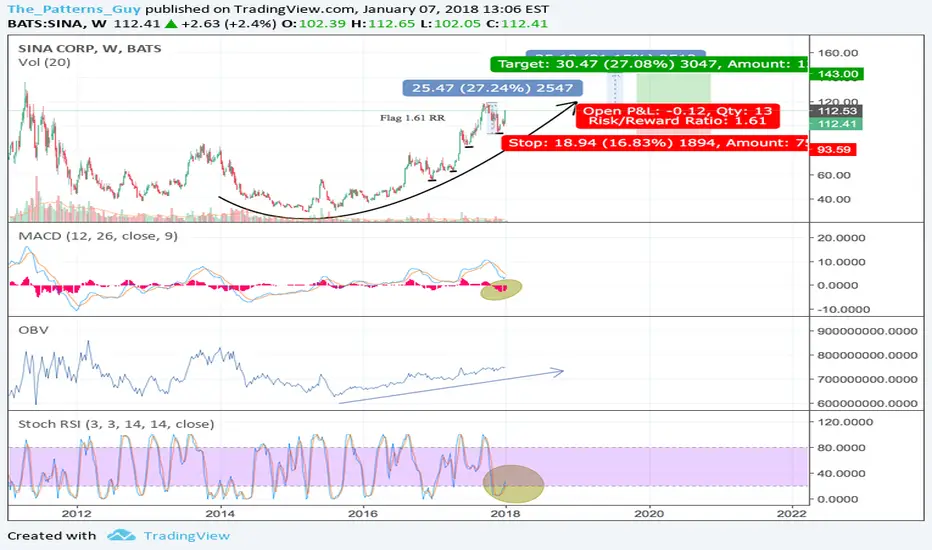
SINA is setting up for a nice 1.61 RR on the weekly chart. MACD is leaning towards crossing up. Stock RSI is setting up for an up move. OBV is trending smoothly up. Overall shape is closer to a parabolic breakout. Notice angel of ascent continues to rise.
However, please do take not of commentator analysis from Bloomberg:
"Technology, financial and health care stocks are preferred by most analysts in both China and Hong Kong for next year, while commodity, materials and Chinese developers may underperform"
https://www.bloomberg.com/news/articles/2017-12-18/top-forecaster-sees-mergers-driving-chinese-stock-gains-in-2018
Also look how the China stock market is on a steady channel higher.

However, a note of caution. The daily and monthly charts are nothing special.


However, please do take not of commentator analysis from Bloomberg:
"Technology, financial and health care stocks are preferred by most analysts in both China and Hong Kong for next year, while commodity, materials and Chinese developers may underperform"
https://www.bloomberg.com/news/articles/2017-12-18/top-forecaster-sees-mergers-driving-chinese-stock-gains-in-2018
Also look how the China stock market is on a steady channel higher.
However, a note of caution. The daily and monthly charts are nothing special.
Feragatname
Bilgiler ve yayınlar, TradingView tarafından sağlanan veya onaylanan finansal, yatırım, işlem veya diğer türden tavsiye veya tavsiyeler anlamına gelmez ve teşkil etmez. Kullanım Şartları'nda daha fazlasını okuyun.
Feragatname
Bilgiler ve yayınlar, TradingView tarafından sağlanan veya onaylanan finansal, yatırım, işlem veya diğer türden tavsiye veya tavsiyeler anlamına gelmez ve teşkil etmez. Kullanım Şartları'nda daha fazlasını okuyun.