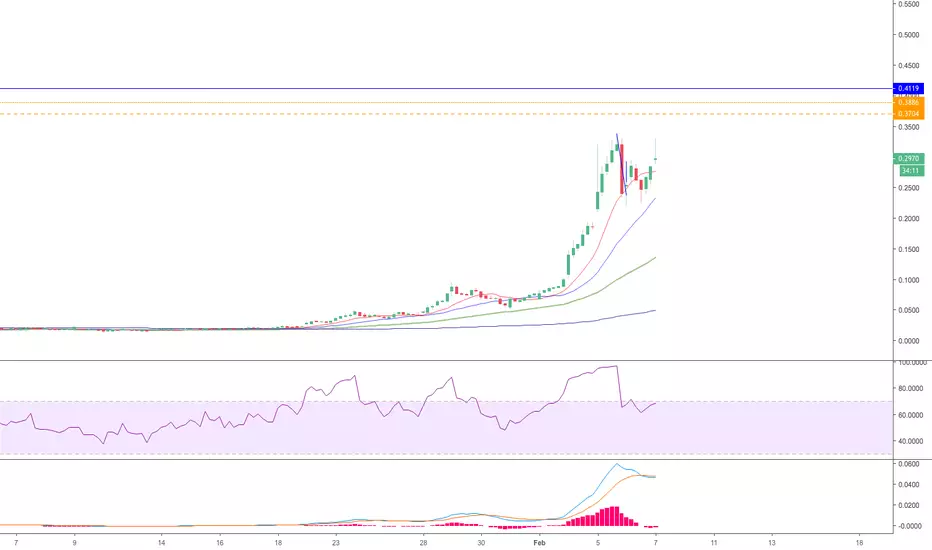
If SHMP can break to new highs, then I will be looking for a reaction at the yellow and blue horizontal lines.
My EW counts have the recent high as either the 3rd or 5th Wave.
Let's see how this plays out.
The yellow lines represent a .618 and .65 fib level.
The blue line is another fib level of interest.
If SHMP does not break to new highs then look below.
Trent Klarenbach
Feragatname
Bilgiler ve yayınlar, TradingView tarafından sağlanan veya onaylanan finansal, yatırım, işlem veya diğer türden tavsiye veya tavsiyeler anlamına gelmez ve teşkil etmez. Kullanım Şartları'nda daha fazlasını okuyun.
Trent Klarenbach
Feragatname
Bilgiler ve yayınlar, TradingView tarafından sağlanan veya onaylanan finansal, yatırım, işlem veya diğer türden tavsiye veya tavsiyeler anlamına gelmez ve teşkil etmez. Kullanım Şartları'nda daha fazlasını okuyun.