Date: July 7, 2025
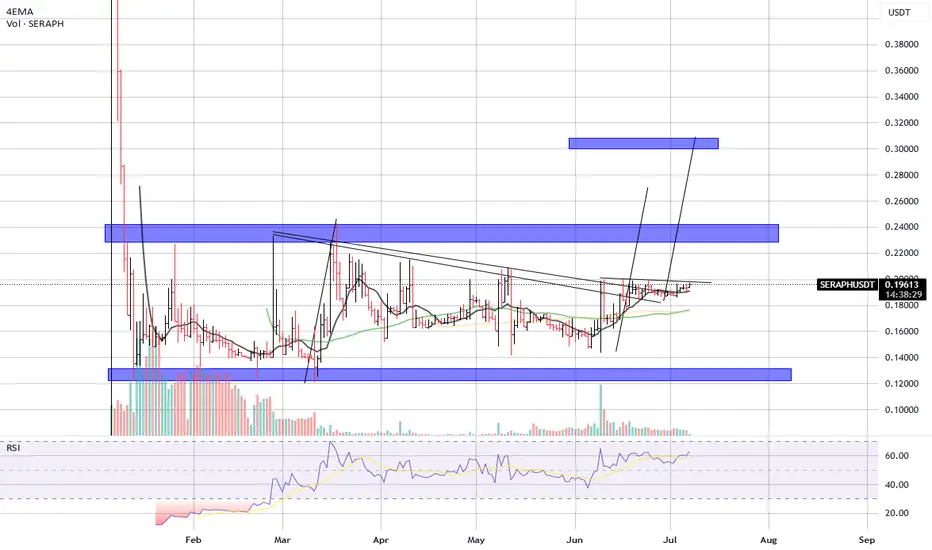
SERAPH/USDT is showing signs of a potential breakout after weeks of accumulation. The price is coiling tightly just below a key descending trendline resistance, forming a bullish structure with higher lows. Volume remains steady, and momentum indicators point toward increasing strength.
📊 Technical Overview:
Current Price: $0.19643
EMA Levels: Price is now above the 4EMA and other moving averages, signaling short-term bullish control.
Structure: The chart is forming a breakout pattern from a descending triangle, with a tight consolidation near the resistance.
📉 Support Zones:
$0.18000 (minor support)
$0.14000–$0.15000 (major historical demand zone)
📈 Resistance/Target Zones:
First Resistance Zone: ~$0.23000–$0.24500
Main Target: ~$0.30000 (measured move and major supply zone)
📊 Indicators:
RSI: 62.81 – approaching bullish breakout territory but still below overbought, suggesting room to rally
Volume: Slight uptick on green candles – suggests growing interest from buyers
🔍 Chart Structure:
Price broke above the descending trendline once but failed to hold.
Since then, it has formed a clean base with steady higher lows and is now retesting the upper boundary.
Multiple tests of resistance increase the likelihood of a breakout soon.
🎯 Upside Projections:
Short-Term Target: $0.23000–$0.24500
Mid-Term Target: $0.30000+
These projections align with the height of the pattern and previous supply areas.
📉 Invalidation:
Breakdown below $0.18000 would delay the bullish setup.
A move below $0.14000 would invalidate the structure and suggest weakness.
Feragatname
Bilgiler ve yayınlar, TradingView tarafından sağlanan veya onaylanan finansal, yatırım, işlem veya diğer türden tavsiye veya tavsiyeler anlamına gelmez ve teşkil etmez. Kullanım Şartları'nda daha fazlasını okuyun.
Feragatname
Bilgiler ve yayınlar, TradingView tarafından sağlanan veya onaylanan finansal, yatırım, işlem veya diğer türden tavsiye veya tavsiyeler anlamına gelmez ve teşkil etmez. Kullanım Şartları'nda daha fazlasını okuyun.