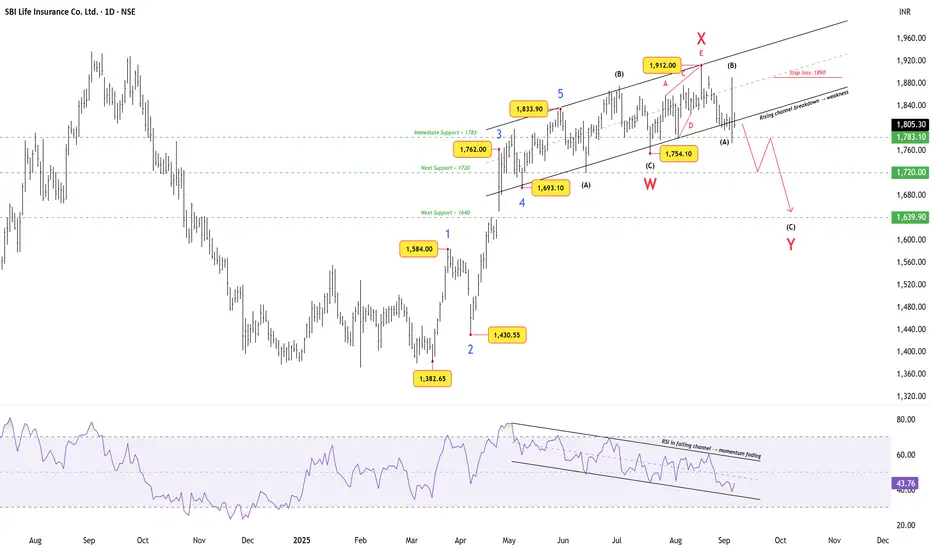
The stock completed a clear 5-wave impulse from ₹1,382.65 to ₹1,833.90.
Since then, the structure has turned corrective, unfolding as a possible W–X–Y pattern.
Disclaimer: This analysis is for educational purposes only and does not constitute investment advice. Please do your own research (DYOR) before making any trading decisions.
Since then, the structure has turned corrective, unfolding as a possible W–X–Y pattern.
- Price action:
Price broke below the rising channel, signaling fading momentum.
Immediate support lies at ₹1,783, followed by ₹1,720, and a deeper level near ₹1,640. - RSI observation:
RSI has been sliding inside a falling channel since May, confirming weakening strength.
Current reading is ~43.7, suggesting momentum is fading further. - Trade bias:
As long as price remains below ₹1,890 (stop-loss / invalidation), the structure favors further downside.
Breakdown continuation could lead toward the ₹1,640 zone, which aligns with the projected end of Wave Y.
Disclaimer: This analysis is for educational purposes only and does not constitute investment advice. Please do your own research (DYOR) before making any trading decisions.
WaveXplorer | Elliott Wave insights
📊 X profile: @veerappa89
📊 X profile: @veerappa89
İlgili yayınlar
Feragatname
Bilgiler ve yayınlar, TradingView tarafından sağlanan veya onaylanan finansal, yatırım, işlem veya diğer türden tavsiye veya tavsiyeler anlamına gelmez ve teşkil etmez. Kullanım Şartları'nda daha fazlasını okuyun.