//version=5
indicator(title="WaveTrend Sinyali ", shorttitle="WT SIGNAL", overlay=true)
// Girdi parametreleri
n1 = input.int(10, "Kanal Uzunluğu")
n2 = input.int(21, "Ortalama Uzunluğu")
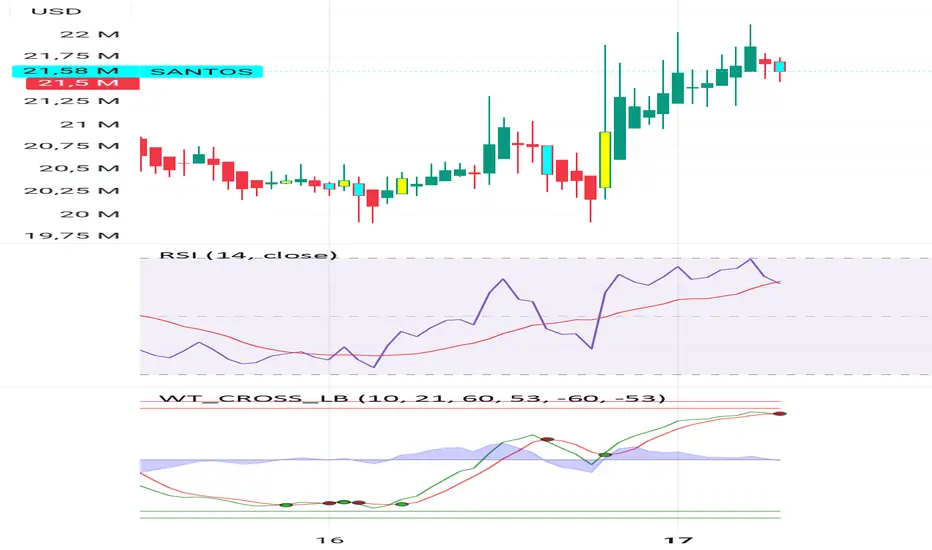
obLevel1 = input.int(60, "Aşırı Alım Seviye 1")
obLevel2 = input.int(53, "Aşırı Alım Seviye 2")
osLevel1 = input.int(-60, "Aşırı Satım Seviye 1")
osLevel2 = input.int(-53, "Aşırı Satım Seviye 2")
// WaveTrend hesaplaması
ap = ta.hlc3
esa = ta.ema(ap, n1)
d = ta.ema(math.abs(ap - esa), n1)
ci = (ap - esa) / (0.015 * d)
tci = ta.ema(ci, n2)
wt1 = tci
wt2 = ta.sma(wt1, 4)
// WT çizgileri
plot(wt1, color=color.green, title="WT1")
plot(wt2, color=color.red, title="WT2")
histo = wt1 - wt2
plot(histo, color=color.blue, style=plot.style_columns, title="Histogram")
// Kesişim ve sinyal kontrolü
bullCross = ta.crossover(wt1, wt2) and wt1 < osLevel1
bearCross = ta.crossunder(wt1, wt2) and wt1 > obLevel1
// Etiketler
if bullCross
label.new(bar_index, low, "AL", style=label.style_label_up, color=color.lime, textcolor=color.white, size=size.normal)
if bearCross
label.new(bar_index, high, "SAT", style=label.style_label_down, color=color.red, textcolor=color.white, size=size.normal)
// Bar renkleri
barcolor(bullCross ? color.aqua : bearCross ? color.yellow : na)
indicator(title="WaveTrend Sinyali ", shorttitle="WT SIGNAL", overlay=true)
// Girdi parametreleri
n1 = input.int(10, "Kanal Uzunluğu")
n2 = input.int(21, "Ortalama Uzunluğu")
obLevel1 = input.int(60, "Aşırı Alım Seviye 1")
obLevel2 = input.int(53, "Aşırı Alım Seviye 2")
osLevel1 = input.int(-60, "Aşırı Satım Seviye 1")
osLevel2 = input.int(-53, "Aşırı Satım Seviye 2")
// WaveTrend hesaplaması
ap = ta.hlc3
esa = ta.ema(ap, n1)
d = ta.ema(math.abs(ap - esa), n1)
ci = (ap - esa) / (0.015 * d)
tci = ta.ema(ci, n2)
wt1 = tci
wt2 = ta.sma(wt1, 4)
// WT çizgileri
plot(wt1, color=color.green, title="WT1")
plot(wt2, color=color.red, title="WT2")
histo = wt1 - wt2
plot(histo, color=color.blue, style=plot.style_columns, title="Histogram")
// Kesişim ve sinyal kontrolü
bullCross = ta.crossover(wt1, wt2) and wt1 < osLevel1
bearCross = ta.crossunder(wt1, wt2) and wt1 > obLevel1
// Etiketler
if bullCross
label.new(bar_index, low, "AL", style=label.style_label_up, color=color.lime, textcolor=color.white, size=size.normal)
if bearCross
label.new(bar_index, high, "SAT", style=label.style_label_down, color=color.red, textcolor=color.white, size=size.normal)
// Bar renkleri
barcolor(bullCross ? color.aqua : bearCross ? color.yellow : na)
İşlem aktif
//version=5indicator(title="WaveTrend , shorttitle="WT", overlay=true)
// Girdi parametreleri
n1 = input.int(10, "Kanal Uzunluğu")
n2 = input.int(21, "Ortalama Uzunluğu")
obLevel1 = input.int(60, "Aşırı Alım Seviye 1")
obLevel2 = input.int(53, "Aşırı Alım Seviye 2")
osLevel1 = input.int(-60, "Aşırı Satım Seviye 1")
osLevel2 = input.int(-53, "Aşırı Satım Seviye 2")
// WaveTrend hesaplaması
ap = ta.hlc3
esa = ta.ema(ap, n1)
d = ta.ema(math.abs(ap - esa), n1)
ci = (ap - esa) / (0.015 * d)
tci = ta.ema(ci, n2)
wt1 = tci
wt2 = ta.sma(wt1, 4)
// WT çizgileri
plot(wt1, color=color.green, title="WT1")
plot(wt2, color=color.red, title="WT2")
histo = wt1 - wt2
plot(histo, color=color.blue, style=plot.style_columns, title="Histogram")
// Kesişim ve sinyal kontrolü
bullCross = ta.crossover(wt1, wt2) and wt1 < osLevel1
bearCross = ta.crossunder(wt1, wt2) and wt1 > obLevel1
// Etiketler
if bullCross
label.new(bar_index, low, "AL", style=label.style_label_up, color=color.lime, textcolor=color.white, size=size.normal)
if bearCross
label.new(bar_index, high, "SAT", style=label.style_label_down, color=color.red, textcolor=color.white, size=size.normal)
// Bar renkleri
barcolor(bullCross ? color.aqua : bearCross ? color.yellow : na)
Feragatname
Bilgiler ve yayınlar, TradingView tarafından sağlanan veya onaylanan finansal, yatırım, alım satım veya diğer türden tavsiye veya öneriler anlamına gelmez ve teşkil etmez. Kullanım Koşulları bölümünde daha fazlasını okuyun.
Feragatname
Bilgiler ve yayınlar, TradingView tarafından sağlanan veya onaylanan finansal, yatırım, alım satım veya diğer türden tavsiye veya öneriler anlamına gelmez ve teşkil etmez. Kullanım Koşulları bölümünde daha fazlasını okuyun.