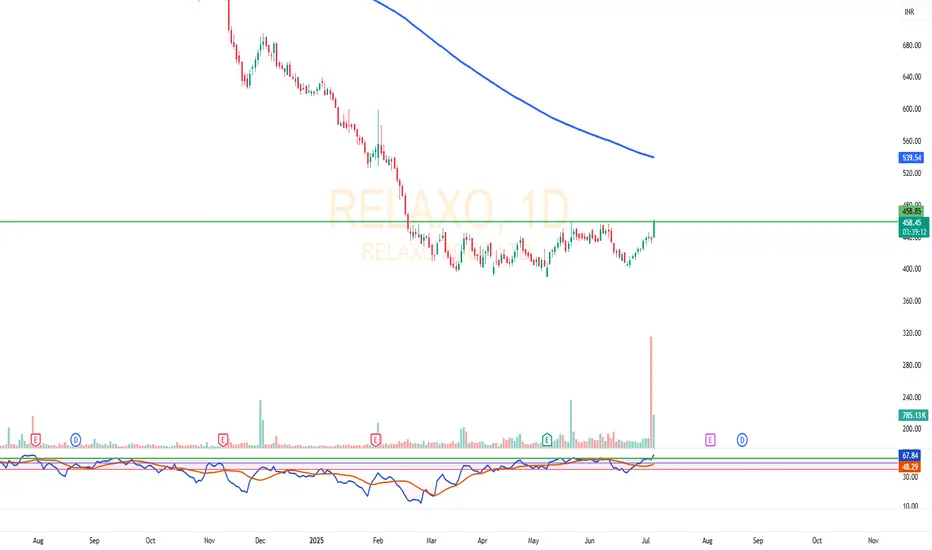
Relaxo Footwears ne daily chart par ₹455 ke aas-paas ek lambi consolidation range (₹370–₹455) se breakout diya hai. Is breakout ke saath significant volume spike bhi dekhne ko mila, jo strong price action ko support karta hai.
🔍 Chart Highlights:
• Price ne multi-month resistance ₹455 ko tod diya hai
• Volume breakout ke din highest in recent months
• RSI indicator 60 ke upar cross kar chuka hai — bullish momentum
• 200 EMA approx ₹539 par hai — potential resistance
📊 Interpretation (Educational Purpose Only):
Ye breakout strong price structure aur buying interest ko reflect karta hai. Agar price is level ke upar sustain karta hai, to momentum continuation ki sambhavna ho sakti hai. 200 EMA agla key level hai jahan price reaction de sakta hai.
⸻
⚠️ Disclaimer:
I am not a SEBI registered advisor. This chart analysis is for educational and informational purposes only. It should not be considered as investment advice. Please consult a certified financial advisor before making any trading decisions.
Feragatname
Bilgiler ve yayınlar, TradingView tarafından sağlanan veya onaylanan finansal, yatırım, işlem veya diğer türden tavsiye veya tavsiyeler anlamına gelmez ve teşkil etmez. Kullanım Şartları'nda daha fazlasını okuyun.
Feragatname
Bilgiler ve yayınlar, TradingView tarafından sağlanan veya onaylanan finansal, yatırım, işlem veya diğer türden tavsiye veya tavsiyeler anlamına gelmez ve teşkil etmez. Kullanım Şartları'nda daha fazlasını okuyun.
