✅ Current technicals
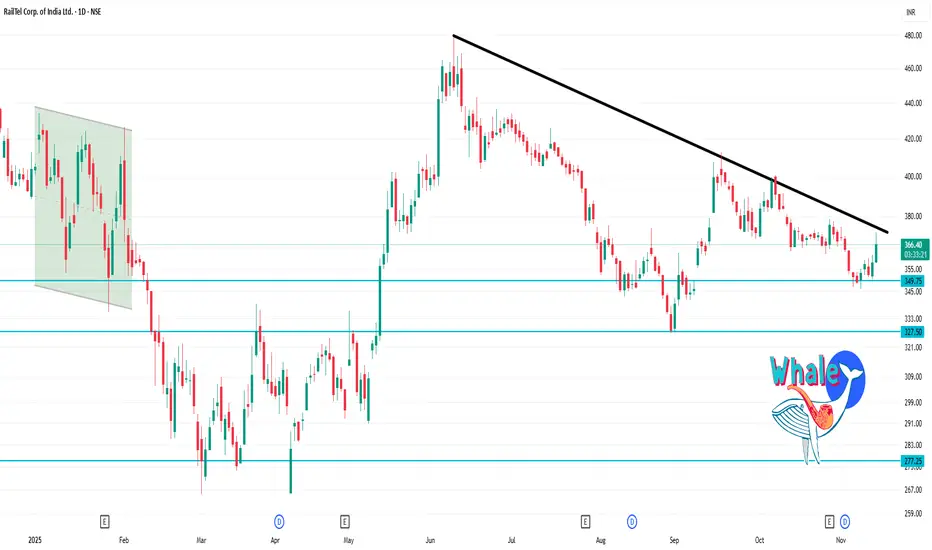
On the daily chart, the stock is near ~ ₹365.70 .
RSI(14) is ~ 63.7 → moderate momentum.
Many moving averages (20/50) are showing “buy” signals, but the 200-day is still above current price, giving a mixed picture.
Trend strength (ADX) is relatively weak/neutral, suggesting the move is not strongly trending.
🎯 Key levels (1-day timeframe)
These are approximate support/resistance and pivot levels derived from recent data.
Pivot & immediate levels
Pivot (classic) ~ ₹368.53.
Resistance 1 (R1) ~ ₹370.66.
Resistance 2 (R2) ~ ₹374.33.
Support 1 (S1) ~ ₹364.86.
Support 2 (S2) ~ ₹362.73.
Wider/more conservative zones
Major longer-term support: ~ ₹351–355 zone (from older pivot S2/S3).
Major longer‐term resistance: ~ ₹374–380 zone.
İlgili yayınlar
Feragatname
Bilgiler ve yayınlar, TradingView tarafından sağlanan veya onaylanan finansal, yatırım, alım satım veya diğer türden tavsiye veya öneriler anlamına gelmez ve teşkil etmez. Kullanım Koşulları bölümünde daha fazlasını okuyun.
İlgili yayınlar
Feragatname
Bilgiler ve yayınlar, TradingView tarafından sağlanan veya onaylanan finansal, yatırım, alım satım veya diğer türden tavsiye veya öneriler anlamına gelmez ve teşkil etmez. Kullanım Koşulları bölümünde daha fazlasını okuyun.