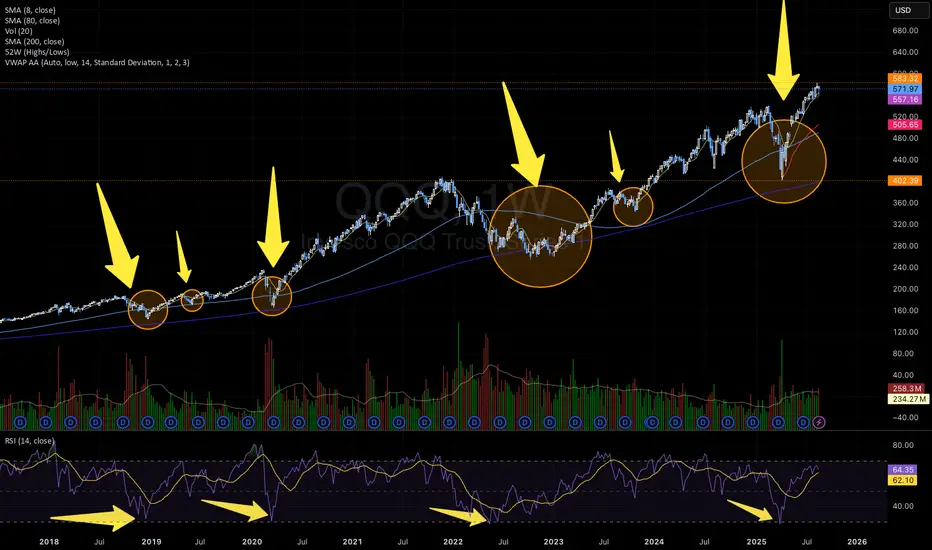
On the QQQ weekly chart, a recurring bullish pattern has emerged multiple times over the last years:
1) V-shape recoveries followed by Cup & Handle formations and then a shakeout, all of which preceded powerful upside moves (highlighted with arrows and circles).
2) Each time the weekly RSI touched the 30 zone, it triggered a strong bullish rally. This happened three times in the past (2018, 2020, 2022) and just occurred again in March/April 2025.
3) Both times the Cup & Handle pattern formed, the RSI found support around the 45 level.
This suggests that QQQ may be setting up for another bullish leg if history repeats itself.
📊 Key Takeaways:
⚠️ Not financial advice — purely a technical pattern study.
1) V-shape recoveries followed by Cup & Handle formations and then a shakeout, all of which preceded powerful upside moves (highlighted with arrows and circles).
2) Each time the weekly RSI touched the 30 zone, it triggered a strong bullish rally. This happened three times in the past (2018, 2020, 2022) and just occurred again in March/April 2025.
3) Both times the Cup & Handle pattern formed, the RSI found support around the 45 level.
This suggests that QQQ may be setting up for another bullish leg if history repeats itself.
📊 Key Takeaways:
- Weekly RSI bouncing from oversold (30 zone)
- Recurrent V-Shape + Cup & Handle + Shakeout bullish pattern
- Strong rallies historically followed this setup
⚠️ Not financial advice — purely a technical pattern study.
Feragatname
Bilgiler ve yayınlar, TradingView tarafından sağlanan veya onaylanan finansal, yatırım, alım satım veya diğer türden tavsiye veya öneriler anlamına gelmez ve teşkil etmez. Kullanım Koşulları bölümünde daha fazlasını okuyun.
Feragatname
Bilgiler ve yayınlar, TradingView tarafından sağlanan veya onaylanan finansal, yatırım, alım satım veya diğer türden tavsiye veya öneriler anlamına gelmez ve teşkil etmez. Kullanım Koşulları bölümünde daha fazlasını okuyun.