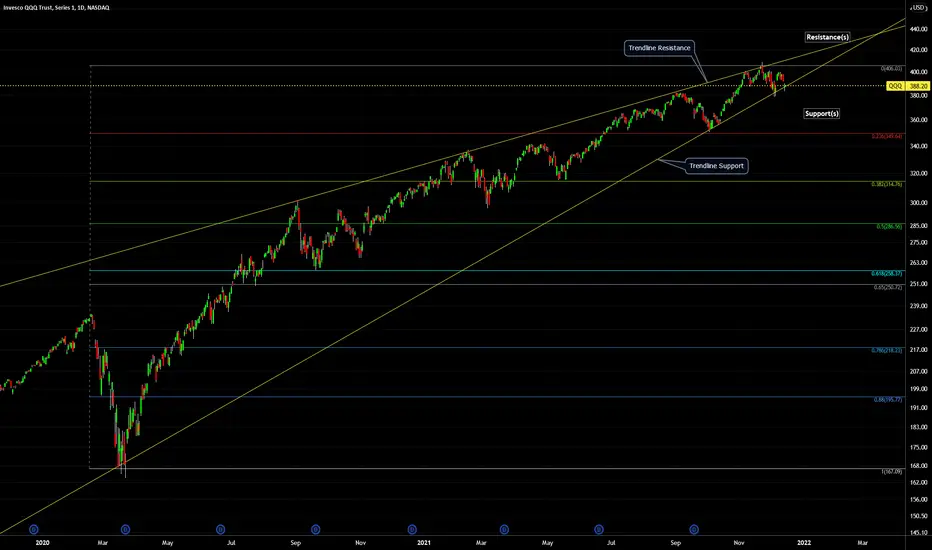
QQQ (Nasdaq ETF) - Support, Resistance, Trendlines - 2021- Daily:
Price Pattern: potential Head-and-Shoulders.
-Resistance Price Levels (colored horizontal lines above current price)
-Support Price Levels (colored horizontal lines below current price)
-Trendline Resistance (diagonal yellow lines above current price)
-Trendline Support (diagonal yellow lines below current price)
note: chart is on log scale.
Follow Me on TradingView, Youtube, X, Instagram.
Social Media links are in my profile.
Boost, comment, share to support.
All posts are not financial advice.
Social Media links are in my profile.
Boost, comment, share to support.
All posts are not financial advice.
Feragatname
Bilgiler ve yayınlar, TradingView tarafından sağlanan veya onaylanan finansal, yatırım, alım satım veya diğer türden tavsiye veya öneriler anlamına gelmez ve teşkil etmez. Kullanım Koşulları bölümünde daha fazlasını okuyun.