1. AW1!/US10Y is a bond market stress gauge
- This futures-to-UST ratio pushing 27-28 after bottoming near 21 shows a persistent grind higher, which usually reflects firmer demand for risk relative to sovereign debt or a rotation into duration (falling yields) boosting growth-sensitive ratios
- Since the index is making higher highs, the bond market isn’t signaling stress, but it has climbed quickly & these ratios often mean-revert when momentum stalls
No warning yet, but overstretched relative to spring/summer supports QQQ strength unless yields abruptly reverse
2. VIX & COR1M is a volatility pair
- COR1M is usually higher in times of event risk & they’re nearly identical; implying, vol surface is flat (complacency), or no event premium which means the market pricing very low turbulence
- A low VIX near 16-17 historically precedes shakeouts, not crashes, but routine pullbacks
- Given PCE coming Friday, the lack of front-month premium is interesting since it means the market does not fear the print
Optionality is cheap, complacency is high so in this environment, QQQ frequently overshoots then reverts quickly
3. QQQ/VXN shows tech risk appetite
- QQQ/VXN at ~29.3 is high
- Every major rejection in 2025 happened near similar ratio levels
- Whenever it dropped toward the 8-10 area, those were panic low points
- The ratio is now again near upper-bound readings while QQQ is extended above its November anchored VWAP
QQQ tends to pull back when its implied-vol ratio reaches these levels (just vol-adjusted exhaustion)
4. NDX/NDXE
- NDX/NDXE at new highs near +5.4% means mega-caps outperforming the equal-weight index strongly, narrow leadership
- Breadth at risk of weakening
- Earlier in the year, the ratio bottomed near -6%, so we’re 12+ points off the lows which is a huge structural rotation into the giant tech names
- When breadth thins out this much, markets often continue drifting up, but become fragile, making them vulnerable to macro data shocks or rate-expectation flips
Strength, but concentration risk is real
- If yields bounce or VIX wakes up, these narrow rallies unwind fastest
AW1!/US10Y trend is intact (risk appetite steady), VIX & COR1M show no fear & NDX/NDXE leadership remains strong (mega-caps still carrying the market)
- QQQ/VXN is at a historical “exhaustion”
- Volatility extremely cheap ahead of PCE which signals complacency
- Breadth is narrowing so this rally is fragile
Mild pullback retest ($610-$615)
- 55%
- QQQ/VXN elevated, VIX suppressed, breadth narrow
Sideways to mild grind up
- 30%
- Mega-caps still leading; bonds not flashing risk
Sharp continuation breakout
- 10%
- Requires dovish PCE + yields breaking lower
Deep correction (<$600)
- 5%
- No stress signals in VIX, COR1M, or AW1!/US10Y
A pullback into $610–$615 is the most statistically likely move & PCE is the catalyst that can either validate the rally (soft print), or trigger the volatility reversion
- Headline/Core PCE prints below expectations (Market pricing: ~0.2% m/m for both)
Soft PCE (0.0-0.1%)
- Yields drop immediately; rate-cut odds spike
- QQQ breakout, testing $630-$638
- 25%
Very soft shock (0% + downward revisions)
- Large drop in yields; USD falls
- QQQ surges, possible new ATH behavior
- 5%
- QQQ is already stretched so upside reaction may fade
Inline PCE (0.2%) is consensus
1. Inline, Goldilocks
- Minor yield drift; VIX barely moves
- Sideways or slight drift up to $625-$632
- 25%
2. Inline, but revisions hotter
- Algo knee-jerk down, then fades
- Pullback to $612-$616 then mean reversion
- 10%
- This is the most likely, but because positioning is stretched, even inline data can trigger a small shakeout
Hot PCE (0.3%) or slightly above expectations
- Mild upside miss (0.3%)
- Yields pop; VIX lifts from complacent levels
- QQQ immediate dip to $610-$615
- 20%
Sticky services strength
- Market interprets “Fed won’t cut early 2026”
- Volatility expansion, QQQ drops to $605-$610
- 5%
- This aligns with a stretched QQQ/VXN & narrow NDX/NDXE breadth
Hotter/bad PCE (≥0.4%) is the tail risk
- 0.4%+ surprise
- Sharp yield spike; VIX 1-2 pts higher
- QQQ breaks wedge to $598-$605
- 7%
0.5%+ shock
- Markets start repricing full Q1/Q2 cuts are gone
- QQQ cascade to $585-$593
- 3%
- Low probability, but highest downside convexity
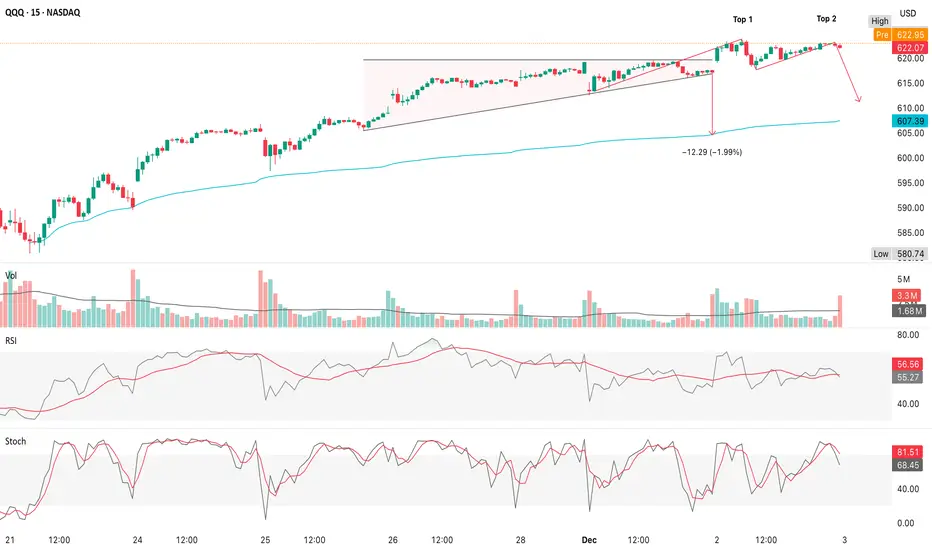
The 15m chart shows that the bearish setup is more developed, more mature & now technically actionable, but still missing one final trigger
- Unless the retest invalidates, the bias is now tilted to the downside
- The $618-$620 neckline is the decision point
- A break of $618 suggests an active target = $612 to $610
- Bulls aren’t fully in control, but bears don’t win yet
- A break above $623.5 invalidates the topping pattern
- Unlikely right now based on momentum & volume
1. Five sessions ago
- Bearish odds ~10-15%
2. Three sessions ago
- Bearish odds ~25-30%
3. Yesterday
- Bearish odds ~40%
4. Now
i) Bearish scenario ($612-$610)
- 55%
- This is now the base case
ii) Chop between $620-$623
- 35%
- Because bulls remain “not broken,” but not advancing
iii) Bullish breakout above $623.5
- 10%
- Momentum doesn't support this upside move
Bears now have the advantage (technically)
- Bearish trigger at $618
- Once $618 breaks, $610 becomes the high-probability magnet
I am not a licensed professional & these posts are for informational purposes only, not financial advice.
Feragatname
Bilgiler ve yayınlar, TradingView tarafından sağlanan veya onaylanan finansal, yatırım, alım satım veya diğer türden tavsiye veya öneriler anlamına gelmez ve teşkil etmez. Kullanım Koşulları bölümünde daha fazlasını okuyun.