It's a time for Peloton Interactive, Inc. (PTON)-Target 8.20 $
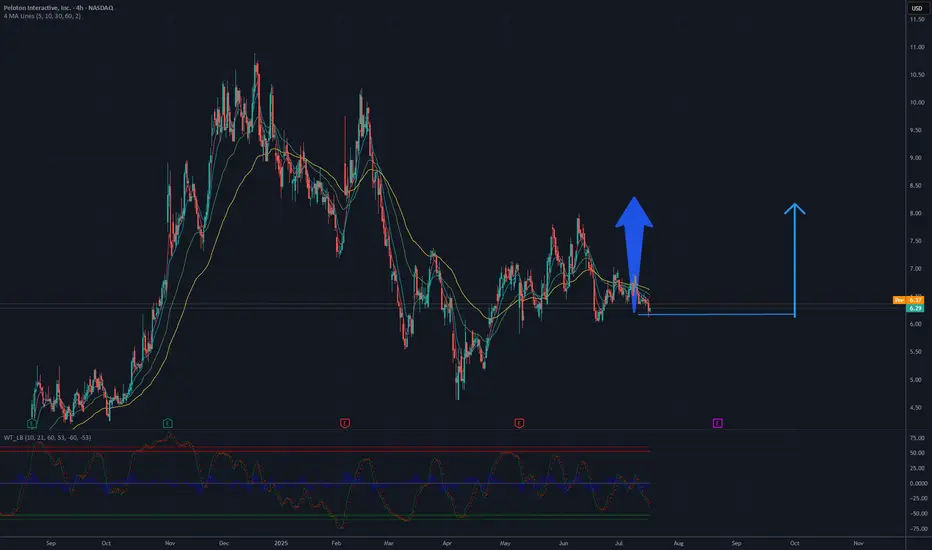
The chart analysis for Peloton Interactive, Inc. (PTON) suggests a potential rise with a target of 8.20 USD. The 4-hour chart indicates a recent downtrend from a peak around 10 USD, with the current price stabilizing near 6.30 USD. A key support level is observed around 6 USD, which could provide a strong base for an upward move. The 50-day and 200-day moving averages are converging, hinting at a possible trend reversal if buying pressure increases.
Breaking through the resistance at 6.50-6.70 USD, a recent consolidation zone, could trigger a rally. With rising volume and bullish candlestick formations, the price may aim for 8.20 USD, a significant resistance level based on prior highs. The RSI, currently in oversold territory, could support this upward movement if it starts to recover, indicating renewed momentum. However, a drop below 6 USD support could invalidate this outlook and lead to further declines.
Potential TP: 8.20 USD
İşlem kapandı: hedefe ulaştı
Target Done!Feragatname
Bilgiler ve yayınlar, TradingView tarafından sağlanan veya onaylanan finansal, yatırım, alım satım veya diğer türden tavsiye veya öneriler anlamına gelmez ve teşkil etmez. Kullanım Koşulları bölümünde daha fazlasını okuyun.
Feragatname
Bilgiler ve yayınlar, TradingView tarafından sağlanan veya onaylanan finansal, yatırım, alım satım veya diğer türden tavsiye veya öneriler anlamına gelmez ve teşkil etmez. Kullanım Koşulları bölümünde daha fazlasını okuyun.