goo.gl/1cUgzK Simple technical analysis suggests PRAA stock price is resuming its uptrend.
Here is what I've spotted at the daily chart:
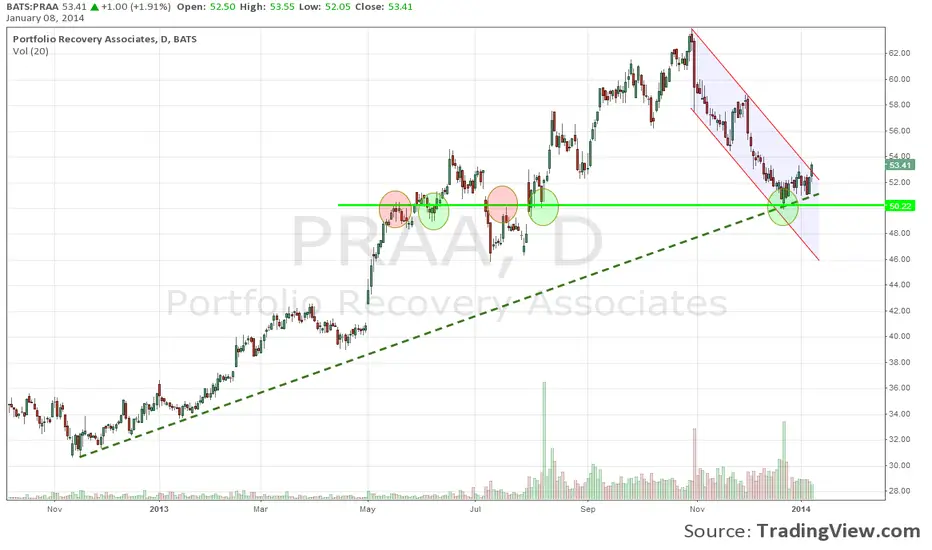
1. Retracement back to the major trend line. Confirmation in December, 2013.
2. Confirmation occurred at another key support and resistance level at $50. Also a round number!
3. The trending channel of the pullback that began in November is failing today. Stock price has penetrated the upper band.
Disclaimer: I'm long PRAA.
Here is what I've spotted at the daily chart:
1. Retracement back to the major trend line. Confirmation in December, 2013.
2. Confirmation occurred at another key support and resistance level at $50. Also a round number!
3. The trending channel of the pullback that began in November is failing today. Stock price has penetrated the upper band.
Disclaimer: I'm long PRAA.
Feragatname
Bilgiler ve yayınlar, TradingView tarafından sağlanan veya onaylanan finansal, yatırım, işlem veya diğer türden tavsiye veya tavsiyeler anlamına gelmez ve teşkil etmez. Kullanım Şartları'nda daha fazlasını okuyun.
Feragatname
Bilgiler ve yayınlar, TradingView tarafından sağlanan veya onaylanan finansal, yatırım, işlem veya diğer türden tavsiye veya tavsiyeler anlamına gelmez ve teşkil etmez. Kullanım Şartları'nda daha fazlasını okuyun.